What are the results you can record with a radio telescope? In this article you can see spectra, cross-scans and radio maps you can record with SPIDER radio telescopes. When we record a picture of an Universe object, we usually use a digital camera that has many pixels (typically several millions). This way, when we record the picture, the light we receive “lighten” many pixel at the same time and each pixel records light coming from different sky areas. But, when we use radio telescopes, we record the signal from a single area of the sky (only large professional radio telescopes may have more LNA units), just as if our camera had only one pixel.
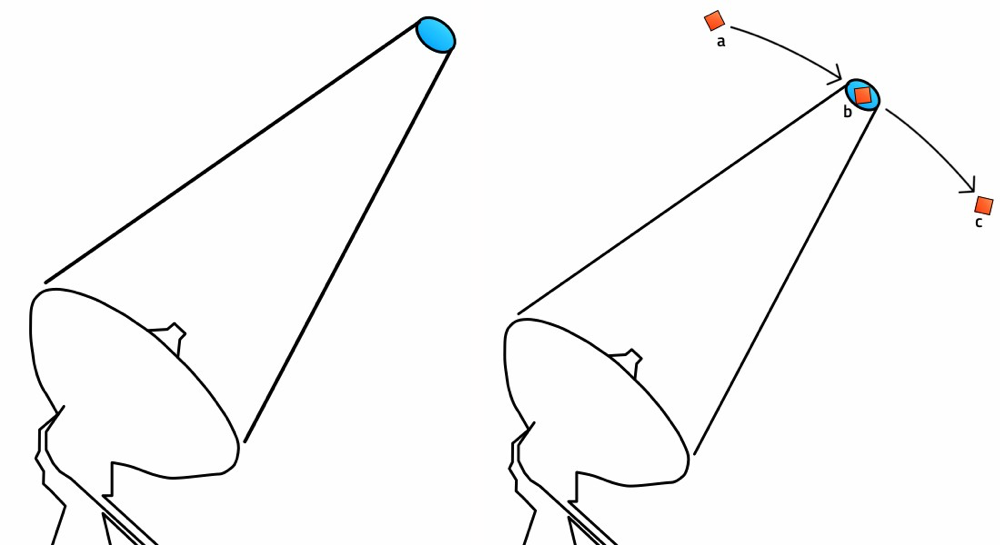
If the instrument is equipped with a precise automatic pointing and tracking system, and you have the coordinates of Universe radio sources in the sky (as in our SPIDER radio telescopes), you can point the antenna to the correct direction, and then record the radiation flux coming from the object itself. This is relates to the power of the signal emitted by the radio source. The type of data obtained depends on the receiver characteristics and by the fact that the measure could be calibrated or not. That’s why, in general, the first result you get radio telescopes pointing the sky is a number.

Results of radio telescope: on the left, radio telescopes record the radio waves coming from a specific area of the sky. On the right, radio telescopes can also record cross-section of the radio source to study.
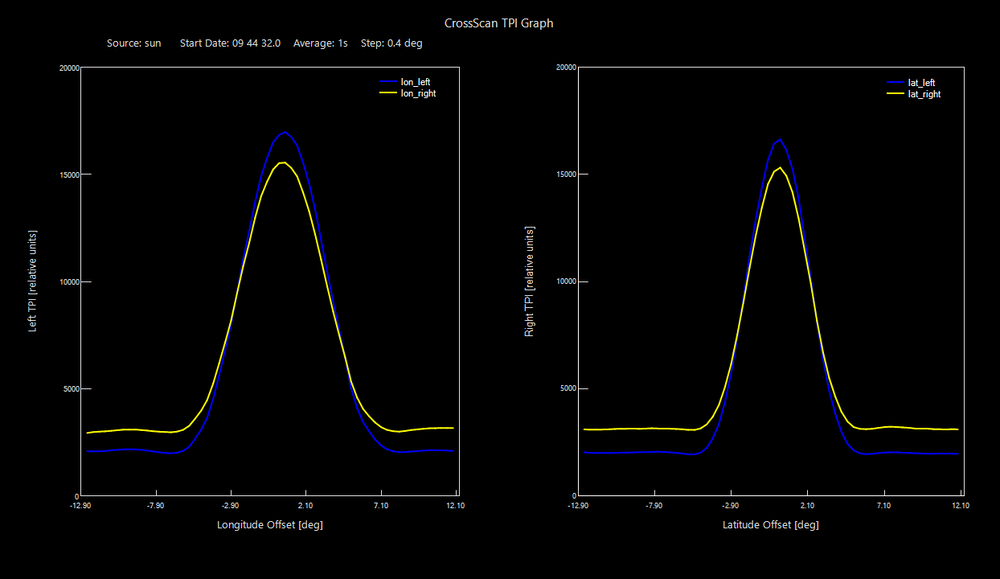
Another result type that can be obtained with radio telescopes is a cross-scan. This technique consist in pointing the radio telescope to the selected target and command data acquisition by moving the antenna in azimuth and elevation, this way creating a cross section centred on the target with the antenna tracking system, with a faster speed than sidereal rate. We can thus record a curve of values and, if the radio source is perfectly centred, the resulting central peak has a direct correlation with the radio emission coming from the source. This type of result is very interesting since it allows to evaluate also antenna parameters such as the resolution capabilities of the antenna and is also used to verify performance of radio telescope.

The results of radio telescopes: Cross-Scan the Sun recorded by SPIDER 300A radio telescope.
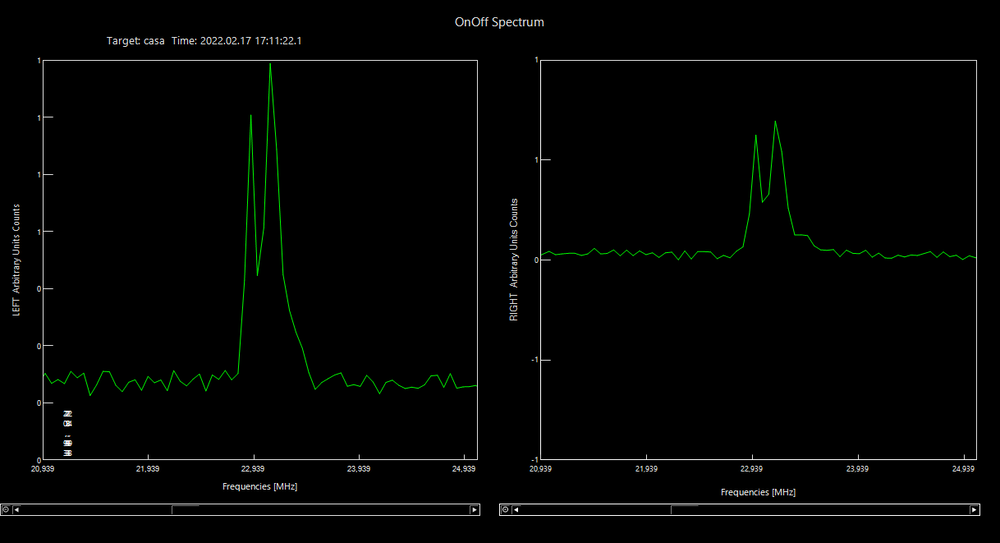
By using a specially designed receiver and backend, like our SPIDER radio telescopes, the captured signal coming from a precise area of the sky may be sampled with a digitiser. This way the radio telescope is able to detect also the spectrum of the target. This is particularly interesting when the user wants to detect particular emission lines like the neutral Hydrogen line emitted by the Milky Way.

The results of radio telescopes: spectrum of Cassiopea A showing the neutral Hydrogen line at 1420 MHz, captured with SPIDER 300A radio telescope.
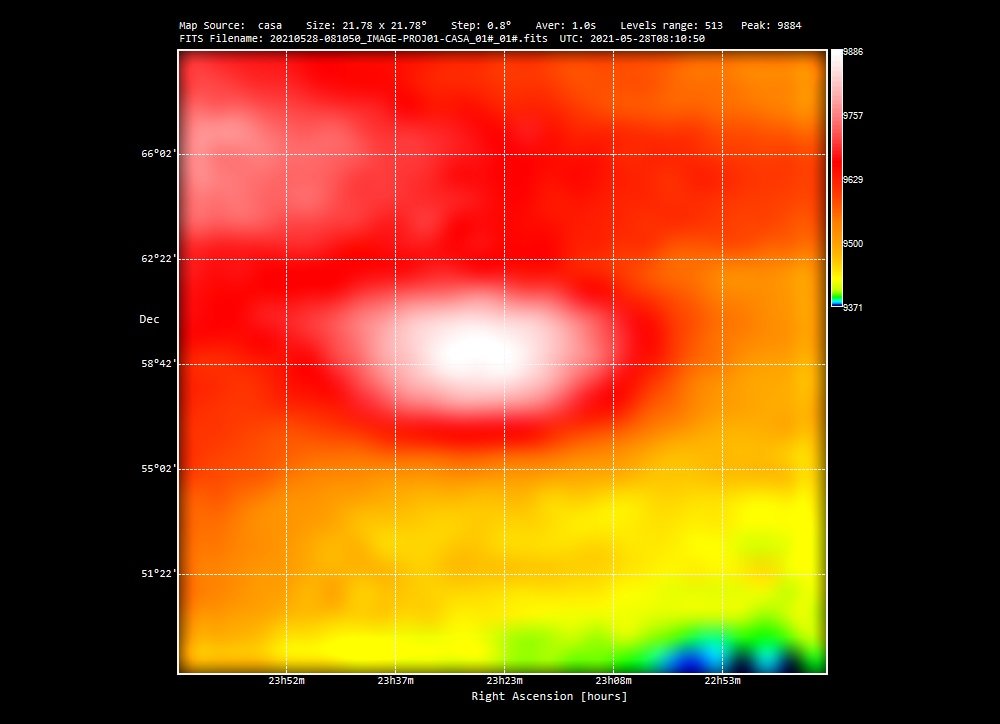
If the radio telescope has a precise tracking and automatic pointing system, we can record a radio map of the object that we want to study. This allows us to record an image of the object radio emission. In order to do so, the radio telescope is continuously moved by scanning the desired sky area and recording the radio emission which comes from each pixel that compose our image. Some pixels will record a different quantity of radio waves from the adjacent ones and each number is then associated with a color, this way generating a radio image of the object! Our SPIDER radio telescopes allow the user, in a very simple way, to obtain these results with a compact radio telescope by using the RadioUniversePRO software. In the image below, you can see a radio map of the Cassiopea A supernova remnant recorded with SPIDER 300A radio telescope.

The results of radio telescopes: radio map of Cassiopea A recorded with SPIDER 300A radio telescope. Each pixel corresponds to a numerical value proportional to the intensity of the radio emission coming from a precise sky area.
