Study of the galactic hydrogen distribution with SPIDER 300A radio telescope
by
Sandri Mario (1,2), Antonacci Simone (2), Bellotti Tommaso (2), Bonadiman Simone (2), Cavallari Silvia (2), Goldoni Michele (2), Poletti Francesco (2), Soussane Marwa (2), Tavonatti Carlotta (2), Zanella Francesco (2), Zanella Giovanni (2)
(1) IARA, Astronomia Valli del Noce, SdR RadioAstronomia UAI, IMO
[email protected], www.astronomiavallidelnoce.it
(2) Liceo “Bertrand Russell” Cles (TN)
1. Introduction
Our galaxy is an SBbc medium size and mass spiral type. It is only partially visible, since we are inside it; the plane of the disk and the thousands of stars it contains appear to us as a milky white stripe on the celestial vault, called the Milky Way. The Galaxy is composed of a central core, a bulge, a disk and a halo. In particular, the disc contains the spiral arms. The spiral nature of the Milky Way was confirmed through the study of the distribution of the HII regions, consisting mainly of bright nebulae of ionized hydrogen (HII) that form right inside the spiral arms. The spiral arms are regions of active formation of new stars, dominated by young stars, dust and gas.
It is possible to derive the rotation curve of the Milky Way, map the spiral structure of the Galaxy itself, to determine the integral mass, i.e. the mass contained in concentric shells, in particular in correspondence with the Sun and describe the kinematics of the Milky Way by means of the Oort constants through the study of the concentration of galactic hydrogen, the most abundant element present in the universe and located on the arms of spiral galaxies.
The universe is composed minimally of planets and celestial bodies, most of the galaxy is composed of gases (molecules, atoms, ions) that form interstellar matter. Among the various elements present in space, the most common is atomic hydrogen HI. Atomic hydrogen is the simplest atom: it is formed only by a proton and an electron. The ground state of the hydrogen atom consists of two levels that correspond to the parallel and antiparallel spin configurations of the electron and proton. The energy difference between the two levels corresponds to the emission of a photon with 1420 MHz frequency, corresponding to 21cm wavelength. The greatest intensity of the signal is found on the galactic plane as the concentration of hydrogen is greater. The bodies that make up the Milky Way are not stationary: they revolve around the galactic center. All objects observed from the Earth are therefore in motion with respect to it, which in turn is moving. As a consequence of this, also the wave emitted by the hydrogen is shifted: the observed frequency is different from that actually emitted by the source. Radio astronomers use the Doppler effect to calculate the speed at which celestial objects move relative to the Earth.
2. The radio telescope and data acquisition
The instrument used for this study is the SPIDER 300A radio telescope designed by PrimaLuceLab and allows schools, universities, scientific museums and other educational institutes to carry out radio astronomy research. Designed with the same functionality as a large professional radio telescope, SPIDER 300A is a complete, reliable and easy to use instrument. It comes with a 3 meter diameter parabolic antenna, which ensures a high gain and a waterproof altazimuth mount with high load capacity that allows high movement precision. It comes with a receiver designed to receive 1420 MHz frequency with 50 MHz instantaneous bandwidth. Everything is remotely controlled by the RadioUniversePRO software that controls the radio telescope and records signals.
This is a time-lapse video shows the SPIDER 300A radio telescope during capture of the data used for this study about the galactic hydrogen distribution:
Data acquisition was done by PrimaLuceLab staff by using the SPIDER 300A radio telescope (installed at the “Marcello Ceccarelli” Visitor Center of Medicina radio telescopes – Italy – near the Croce del Nord professional radio telescopes and the large 32 meter diameter dish) with the addition of BKND-Pro backend (actually in development) that allows acquisition of high-resolution spectra. Galactic hydrogen spectra were recorded from areas located on the galactic plane with longitudes from 0° to 210° with intervals of 2° from one spectrum to another. The integration time of each set was 180 s. The data were recorded in text format, returning the signal strength in arbitrary units at each sampled frequency (from 1419.25 to 1421.75 MHz with 4000 channels).
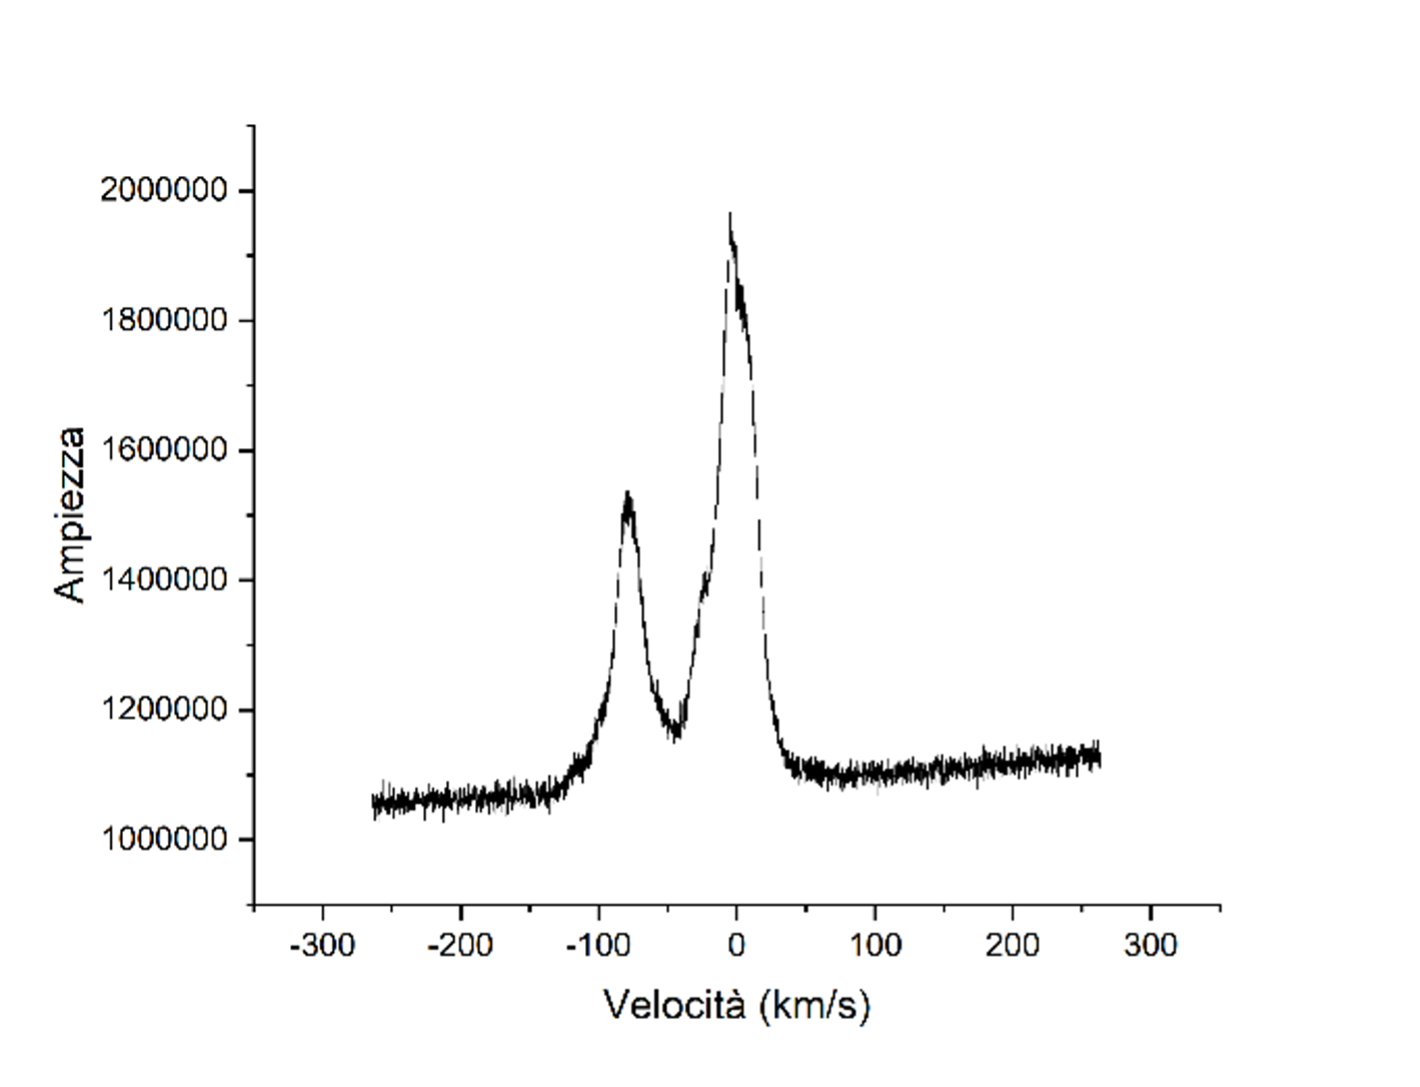
Study of the galactic hydrogen distribution with SPIDER 300A radio telescope: one of the emission spectra of galactic hydrogen captured with SPIDER 300A
3. Spectra analysis
For each data set the position and intensity parameters of the various peaks were obtained. The Doppler effect can be clearly seen, in fact the maximum peak of the graph, which indicates the concentration of hydrogen, does not have 0 as abscissa, but is slightly shifted to the right or to the left and this indicates a move away or an approach of the gas cloud. Leaving aside the mathematical procedure that allowed us to process the data, we highlight the obtained results. Proceeding in sequential order, the rotation curve of the Galaxy in the first quadrant was initially obtained.
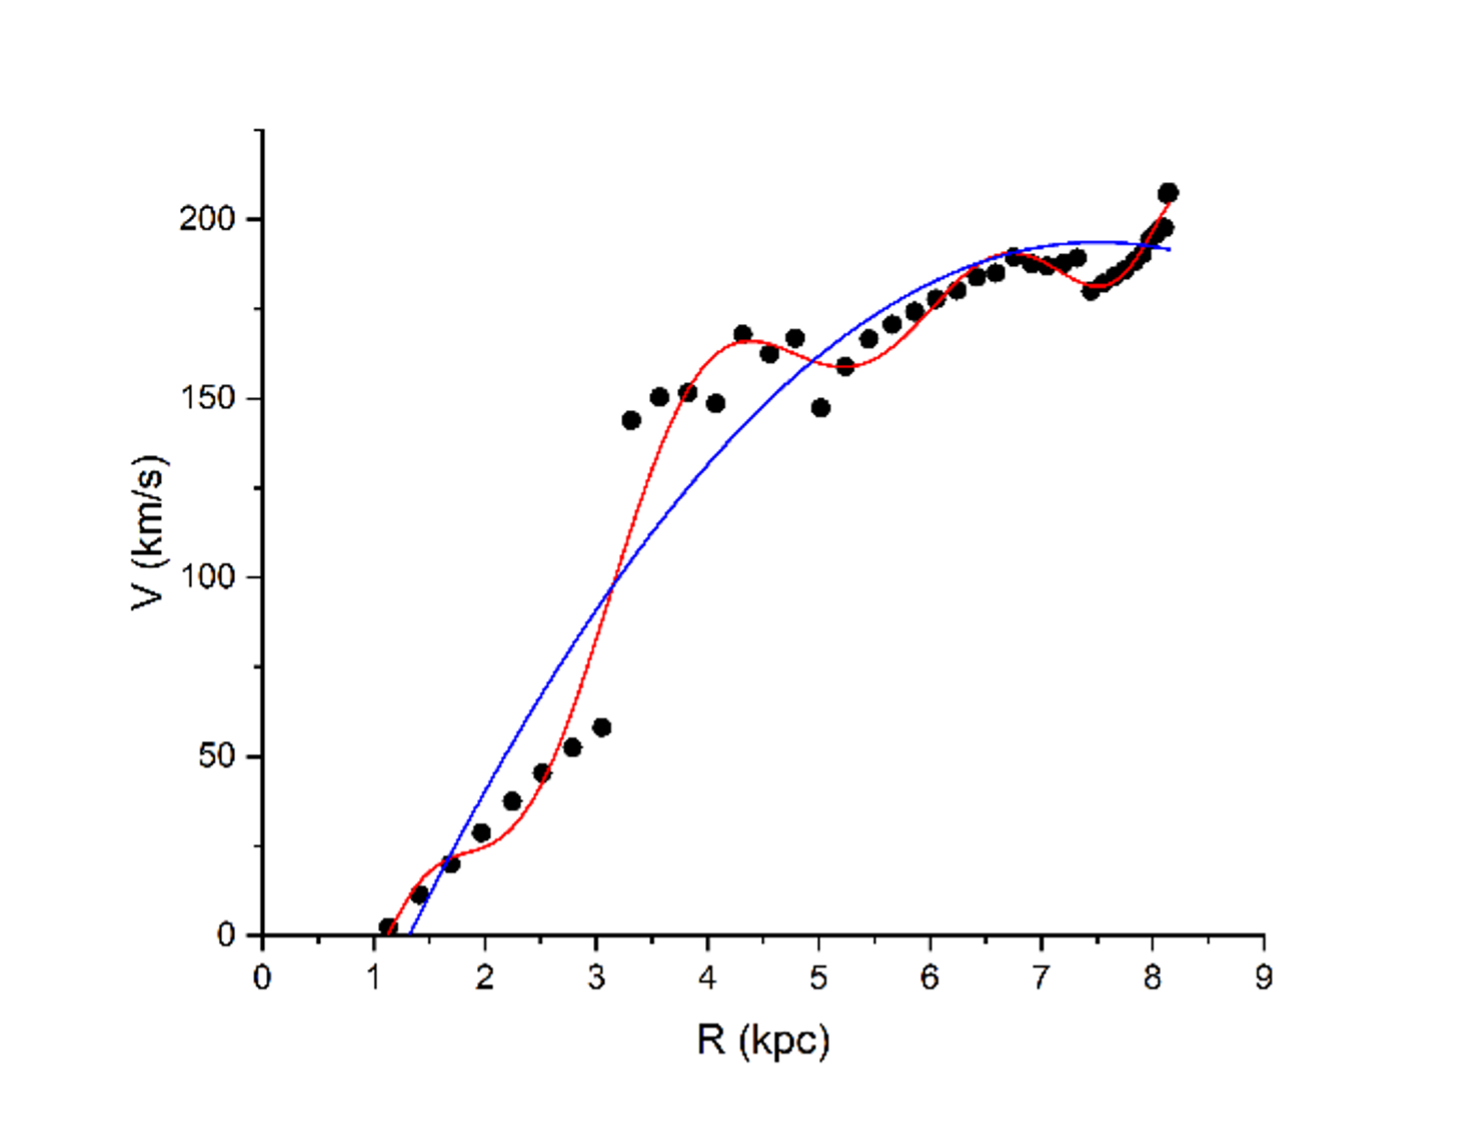
Study of the galactic hydrogen distribution with SPIDER 300A radio telescope: Rotation curve of the Galaxy obtained from experimental data (black dots). The blue line represents the quadratic interpolation, while the red one a polynomial interpolation of ninth order.
The method used to determine the rotation curve of the Galaxy has limits of use for longitudes of less than about 10°, since the Doppler effect is not particularly noticeable. Furthermore, this method for speed estimation cannot be used for longitudes between 90° and 270°, since in these directions there is no longer a univocal correspondence between speed and distance. The data were also compared with the Clemens rotation curve, which was derived from the survey on the study of the CO line on the galactic plane. This curve is approximated by a seventh degree polynomial whose parameters obtained are visible in the table.
| Parameter | Value |
| A0 | -1149 ± 344 |
| A1 | 2757 ± 747 |
| A2 | -2579 ± 637 |
| A3 | 1226 ± 280 |
| A4 | -318 ± 69 |
| A5 | 46 ± 9 |
| A6 | -3,5 ± 0,7 |
| A7 |
0,11 ± 0,02 |
After obtaining the rotation curve of the galaxy, the radio map of the Milky Way was drawn in the 21 cm hydrogen line.
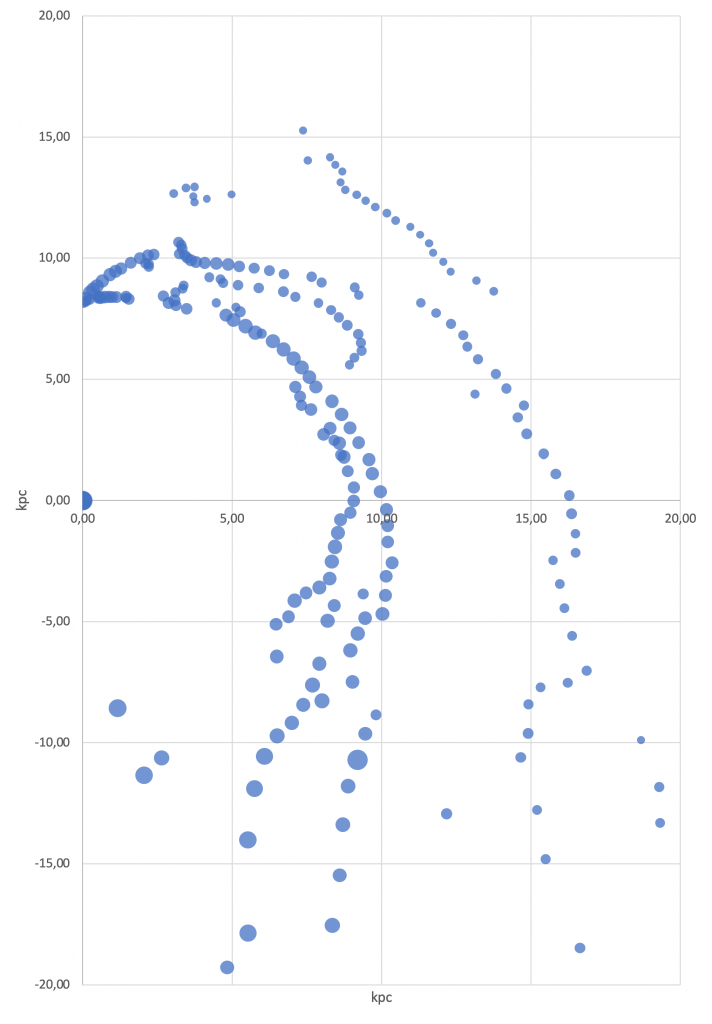
Study of the galactic hydrogen distribution with SPIDER 300A radio telescope: Galaxy structure obtained from experimental data.
From the graph of the distribution of hydrogen obtained from the experimental data, it can be seen that the latter is not uniformly distributed, but appears concentrated in filamentary structures. The latter are considered strong evidence of a spiral structure. This image, in particular, would seem to reveal a spiraling structure highlighting five spiral arms, two of which are well formed and not so marked. By superimposing the image obtained with a representative of the spiral structure of the Galaxy, one can guess how the three spiral arms highlighted are, from top right to bottom left, that of the Regulus-Swan, Perseus, Orion, Carina-Sagittarius and Scutum-Crux.
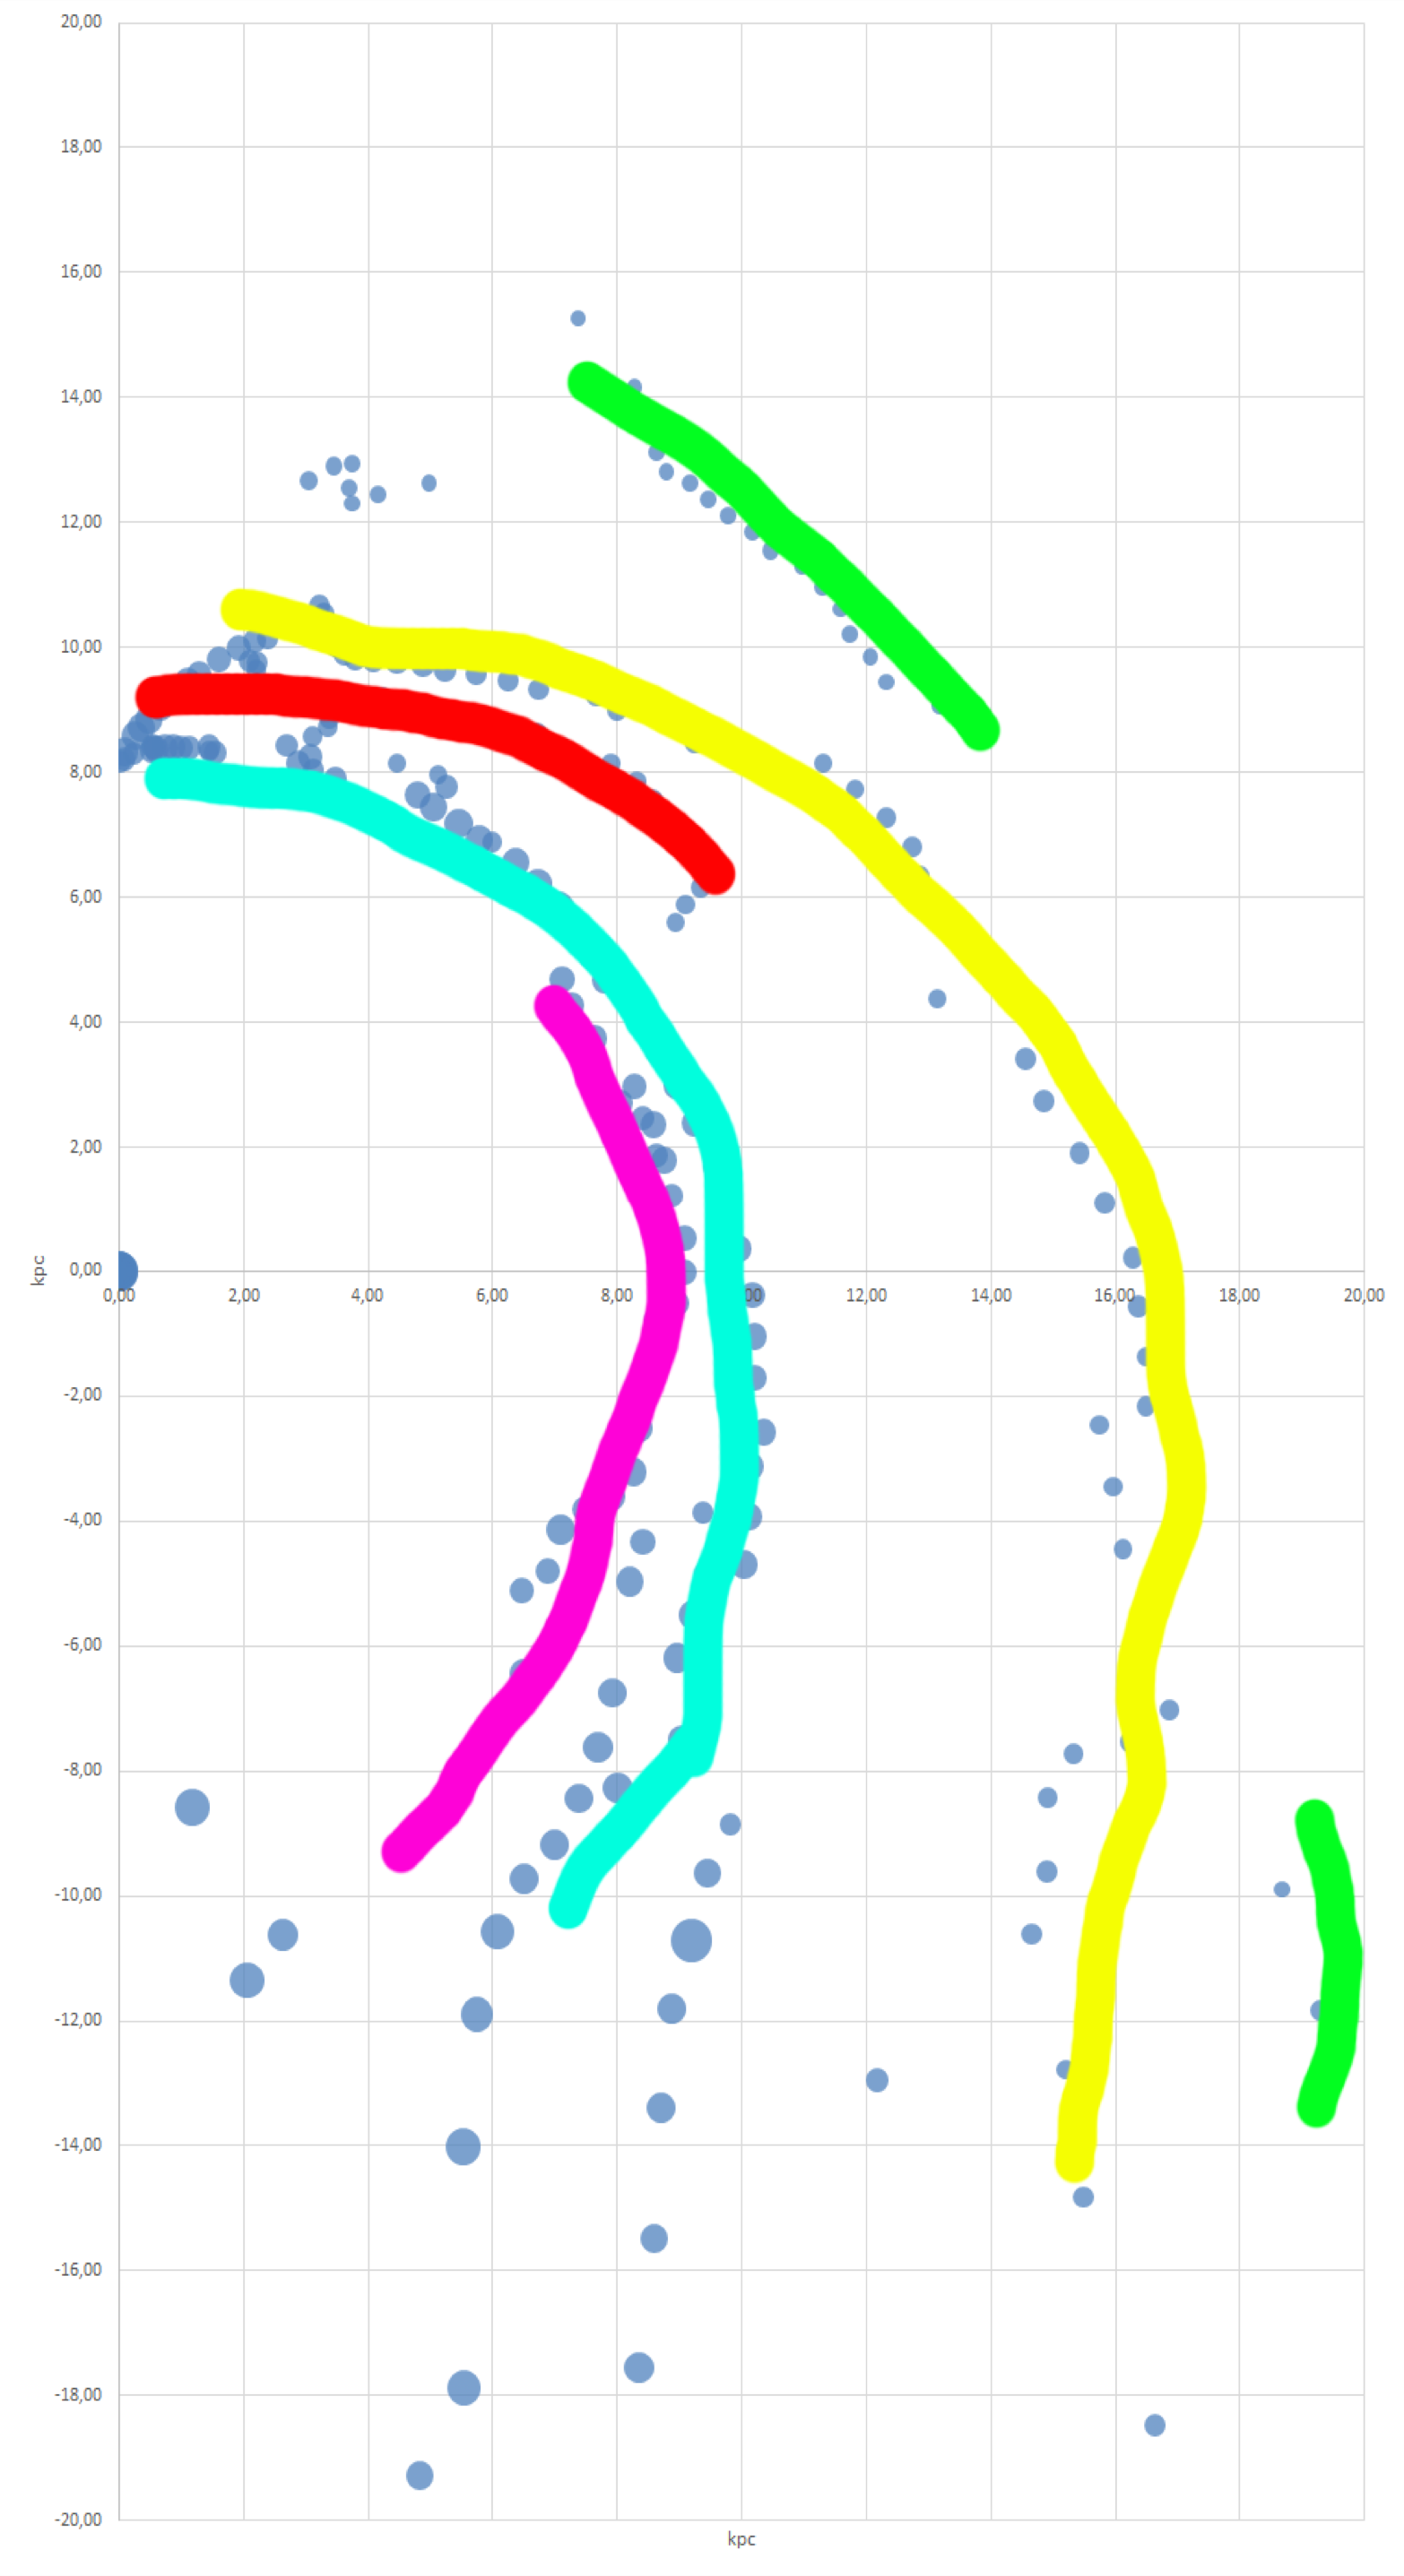
Study of the galactic hydrogen distribution with SPIDER 300A radio telescope: Reconstruction of the spiral arms: Regulus-Swan (green), Perseus (yellow), Orion (red), Carina-Sagittarius (light blue) e Scutum-Crux (fuchsia).
In correspondence with the Sun position there are many experimental points due to the fact that it is surrounded by spiral arms and therefore the presence of hydrogen in this area is abundant. The intensity and size of the various points indicates the intensity of the signal which is an indication of the concentration of hydrogen. As was to be expected, the areas around the position of the Sun have a greater intensity comparable to that of the clouds that are located at almost the same distance from the galactic center. This last feature highlights how the intensity of the hydrogen concentration decreases uniformly in every direction away from the galactic center.
From the knowledge of the rotation curve it was possible to derive the mass of the Galaxy within radius R: this is commonly called integral mass.
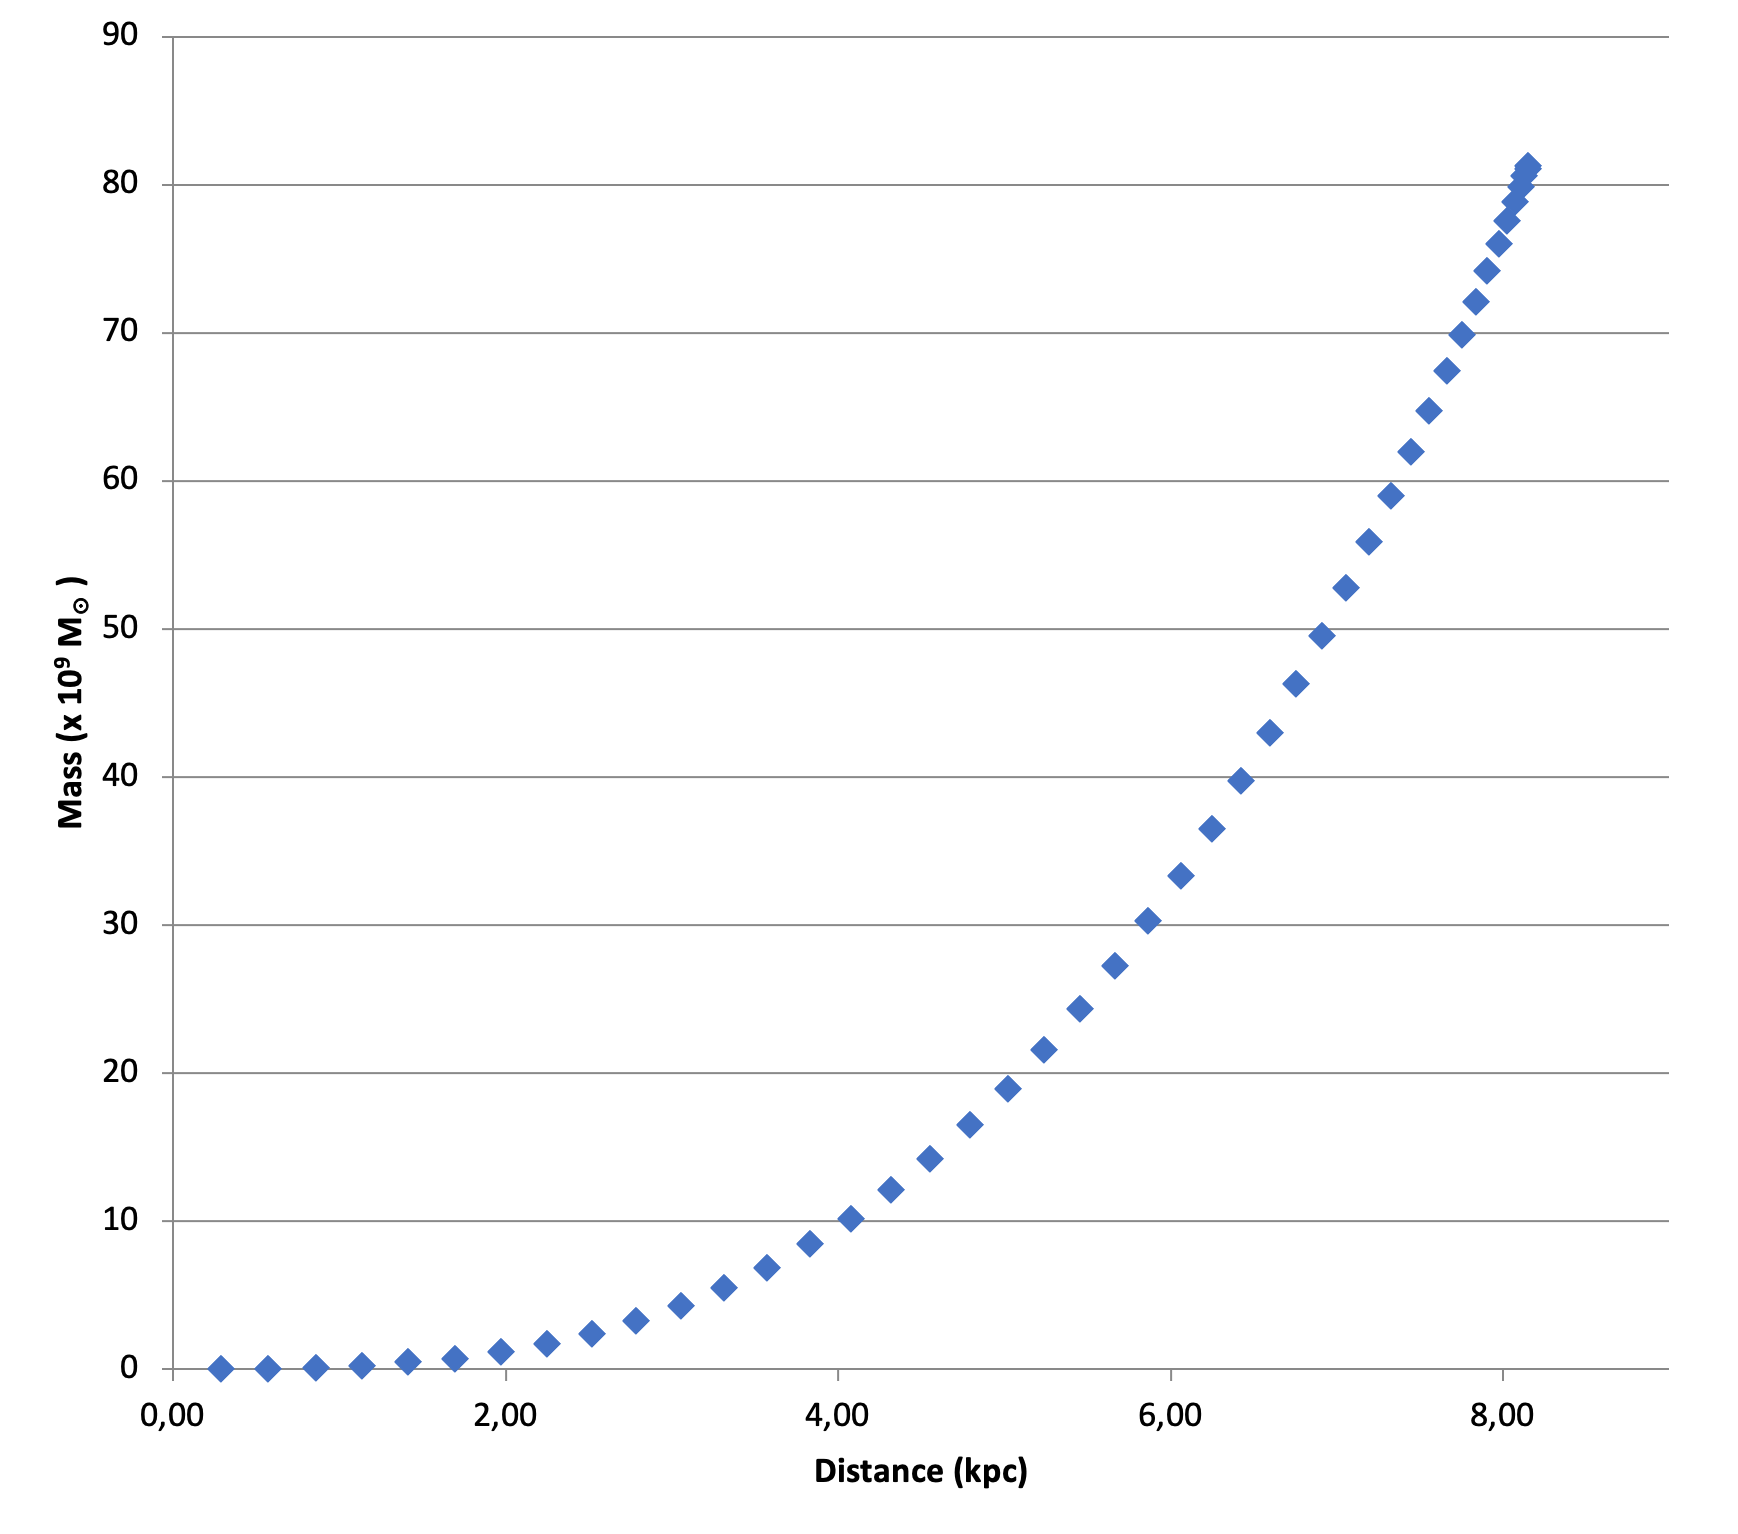
Study of the galactic hydrogen distribution with SPIDER 300A radio telescope: Integral mass as a function of the distance from the galactic center
From the obtained data, galaxy mass is equal to 81.22 x 10⁹ M☉. It’s important to notice that these data do not consider the fact that a supermassive black hole is located at the center of the galaxy, and therefore the values are underestimated. It is impossible, without this hypothesis, which cannot be deduced from the data obtained, to accurately detect the mass of the galaxy. Finally, the Oort constants were calculated considering only the data that met the condition of identifying positions in the vicinity of the Sun.
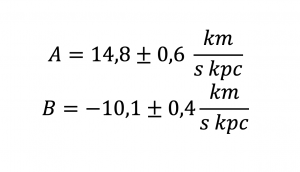
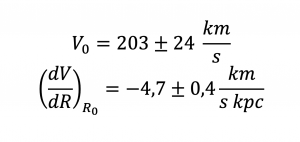
The Oort constants A and B respectively measure the deviation from rigid rotation and local vorticity, from which the angular velocity corresponding to the Sun and the trend of the differential rotation are derived.
4. CONCLUSIONS
From the obtained results, compared with those expected, it emerges that they are in good agreement. In fact, as previously stated, the rotation curve of the Galaxy is comparable, within the limits already stated, with historical values. The map of the Galaxy also reflects the characteristics attributable to other observation campaigns, in particular the historical data acquired, and mainly highlights five structures attributable to five spiral arms. Compared to some researches with amateur instruments, it is evident that the greater sensitivity of the instrument allowed to highlight a much more complex structure than expected. Finally, the mass obtained within the orbit of the Sun is comparable to the one commonly accepted, with the discriminant of not taking into account the mass concentrated in the galactic center, which, as already expressed, is not identifiable with this technique. Finally, the Oort constants were found to be compatible, as already highlighted, with the expected data. The analysis carried out with the data obtained from the PrimaLuceLab SPIDER 300A radio telescope proved to be extremely interesting and allowed us to obtain excellent scientific results.
Acknowledgements. Thanks to Filippo Bradaschia and all PrimaLuceLab staff for providing us with the instrument data that for the first time were used to carry out this type of research.
