

C. S. LEUNG(1), THOMAS K. T. FOK(2), KENNEITH H. K. HUI(2), K. W. NG(3), C. M. LEE(3), S. H. CHAN(3)
(1) Department of Applied Mathematics, Hong Kong Polytechnic University, Hong Kong SAR, P. R. China, Email: [email protected]
(2) Ho Koon Nature Education cum Astronomical Centre, Sik Sik Yuen, Hong Kong SAR, P. R. China
(3) Hong Kong Astronomical Society, Hong Kong SAR, P. R. China
Abstract. Compact SPIDER 300A radio telescope has been used to study the partial solar eclipse at 21 cm wavelength, with magnitude 0.89, in Hong Kong on 21st June, 2020. The radio telescope SPIDER 300A was designed and constructed by the PrimaLuceLab company, Italy. Radio flux density time curves (light curve) and a two-dimension mapping of the eclipse are presented in this paper. Standard radio data reduction methods were used to obtain the intensity time curve. We also adopted the semi-pipeline method for the reduction of data to obtain the same results as with the built-in software of the radio telescope SPIDER 300A. The total solar radio flux of the eclipse was found to reduce by maximum 55±5%, while the maximum eclipsed area of the same eclipse is 86.08%.
Key words: Solar observations.
Solar eclipse observations with SPIDER 300A radio telescope in Hong Kong in the 21cm radio frequency band
1. INTRODUCTION
The first radio solar physics paper was published in 1944 (Reber, 1944). After that, solar radio physics was born. Following this development, several interesting books introducing solar radio physics kept momentum in the field (Kundu, 1965; Kruger, 1979; Kundu and Gergely, 1980; McLean and Labrum, 1985). For solar radio astronomy studies, total or partial eclipses provide great op- portunities for solar radio observations. Solar radio observations primarily are time-dependent. Furthermore, several radio solar eclipse observations were carried out in China in 1958, 1968, 1980 and 1987, and the findings were briefly introduced (Liu and Fu, 1998). On November 3 1994, high spectral and time resolution radio observations of solar eclipse were carried out at Chapeco, Brazil for the first time (Sawant et al., 1997), asymmetrical limb brightening at 1.5 GHz was observed and recorded. Besides, thanks to the advance in technology, sensitivity for the backend system had improved a lot so that two-dimensional mapping for the radio Sun can easily be achieved. Recently, one of the interesting results was published by making use of a UK made telescope at University of Baghdad (Jallod and Abood, 2019). However, the excellent results for the cm radio wave bands can be attributed to the extensive study from Goldstone Apple Valley Radio Telescope Observations (Velusamy et al., 2020). From this study, the observations obtained made us believe that the radio emission originated in the chromosphere and corona; furthermore, they obtained the source brightness temperatures and angular sizes as a function of frequency. These results were made known in terms of gyroresonance mechanism across the active region of the Sun.
Solar eclipse is a rare and attractive event occurring 2-5 times per year. Optical astronomers usually study the solar features happening at the photosphere, chromosphere and corona. We combined radio observations for the 2019 and 2020 solar eclipses by making use of 3 small radio telescopes in Hong Kong. The results were cross checked as to identify any discrepancy. The dates of observations are 26th of December, 2019 and 21st of June, 2020, respectively.
This study has three goals. First, to obtain the time variation of radio two-dimensional spatial mapping of solar eclipses. Second, to obtain total radio flux density time curves (light curve analogy in radio). Lastly, to verify if 21 cm radio band can reveal any physical properties of solar eclipses through analyzing historical worldwide radio eclipses. This paper is also a collection of historic radio observations in Hong Kong, which will make further studies of comparison between radio quiet zone in Hong Kong and that in other countries feasible. Italy, in which our telescopes’ manufacturer PrimaLuceLab company bases, would be the first on our list, as the same SPIDER 300A radio telescope system is also installed at their National Radio Observatory in Bologna.
2. OBSERVATION
Partial Solar Eclipse on June 21, 2020 (magnitude 0.89, max eclipsed area 86.08%)
The radio observations of the eclipse were made on June 21, 2020 at the Ho Koon Astronomical Center (hereafter HKAC, Longitude: 114° 6′ 29.3076′′E, Latitude: 22° 23′ 1.644′′N, Altitude:149m), Stanley Ho Astronomical Observatory (hereafter SHAO, Longitude: 114° 13′ 24.0414′′E, Latitude: 22° 14′ 32.2362′′N, Altitude: 4.6 m), and Physics Building Dome of University of Hong Kong (hereafter HKU, Longitude: 114° 8′ 23.262′′E, Latitude: 22° 13′ 59.7′′N, Altitude: 120 m), respectively.
Small Radio Telescope (SRT), developed by MIT Haystack Observatory, was used in HKAC. SRT is centered at 1,420 MHz with half-power beamwidth (HPBW) of 7 degrees. While SPIDER 300A radio telescope systems, developed by PrimaLuceLab company, were used in both SHAO and HKU. The telescopes were optimized at 1,420 MHz with HPBW of 4.03 degrees. The diameters of the telescopes that we used in SHAO, HKU and HKAC are 3 m, 3 m and 2.3 m respectively with their corresponding bandwidths at 50 MHz, 50 MHz and 50 kHz. The so-called “on-the-fly two dimensional mapping” used at SHAO is indeed a mode of moving the antenna horizontally from left to right. Once the antenna completed mapping the first row, it moves downward and starts the succeeding row. This mode of movement of scanning horizontally and one row downward will continue and repeat until the designated area of sky had been fully scanned.
And the “on-off method” is that the antenna will be operated to scan the designated sky so that the feed horn is made to align to the target “on mode” for a period of time, occasionally the feed horn is made to align to the ambient space “off mode” for another period of time as to get the ambient signals. This “on-off method” is adopted repeatedly during the observing time as to ensure to properly receive the signals as well as the ambient noises.
Always on-source tracking method was used at HKAC and HKU, while on- the-fly two-dimensional mapping method was applied at SHAO, which allowed us to obtain the time variation mapping of radio Sun during eclipse, which will then be presented as sequence diagrams in the later section. The Sun was mapped with a 7 × 7 grid covering 10 × 10 degrees2, and with step size of 1.6 degrees. Integration time for each grid was 1 second. All the data recordings were saved in the standard FITS format.
3. DATA REDUCTION
We note that the calibration system of SPIDER 300A is still under development at the moment of this manuscript being drafted, arbitrary unit and percentage changes were used during analysis. Since the telescope was scanning across the surface of the Sun, the offsets between the telescope axis and the Sun in azimuthal and altitude at each moment were continually varying. Those offset functions of time can be retrieved from fits headers. We can then scale the received power, which is diminishing along the off-axis distance, with respect to each channel according to the beam profile. The scaled powers were added together after flagging particular channels which were severely polluted by the local interference. We assume the solar power spectrum smooth and without strong emissions in any particular frequency, so that flagging some channels will not significantly affect the result if we only consider the percentage changes in power throughout the eclipses. For our SPIDER 300A system is an affordable radio telescope system, the small deviations from the electronic components were inevitable. During the observation, we made use of different gain values for the both left and right hand polarization as to minimise the deviation.
For the 2020 eclipse, the Sun was observed by on-the-fly two-dimensional mapping method mentioned in the previous section. Since the angular distance between the Sun and the measurement center varied from time to time throughout the scanning process, in order to obtain the true radio flux of the Sun at each moment, the power diminishing effect along off-axis distance must be compensated according to the beam profile. The offset distances and beam parameters could be found in FITS, through dividing measured flux by beam respond at corresponding offset, time series of the power change will then be obtained. Power of the uneclipsed Sun is estimated by averaging the data from −6 hr. to −2 hr. before the eclipse maximum.
For comparison, the change of eclipsed area is also included in the plots noted as optical. Equatorial positions of the Sun and the moon were calculated by Skyfield (Rhodes, 2019), and the area changed was calculated according to equations provided in Maplesoft webpage (Jason, 2019).
4. DISCUSSIONS
For this study, we accomplished the 3 major goals mentioned in the Introduction section. Hence, for this discussion, we will make reference on these 3 goals to proceed with detailed consideration.
Time variation of radio two-dimensional spatial mapping of solar eclipses
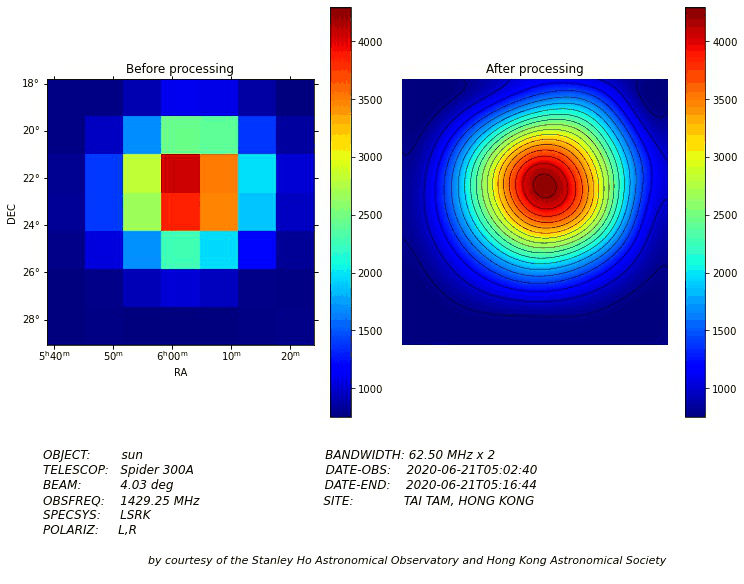
The two-dimensional mapping false colour diagram was created by making use of the 1.42 GHz uncalibrated SPIDER 300A data in arbitrary units from 2020 eclipse at SHAO. The location for the SHAO is in the valley of the Tai Tam reservoir, where a hill blocks the west side of the sky, the last hour of 2020 eclipse was not recorded. Fortunately, the sequence diagrams demonstrating the first contact, partial phases and the maximum eclipse of the partial solar eclipse were obtained. Please be reminded that this was 0.89 partial solar eclipse instead of total solar eclipse. The mapping result is shown in Figure 1. Figure 1 shows a mapping diagram before the solar eclipse. The UT that we made the figure was at 03:56. We adopted 2 s for the integration time and a step size is of 1.614 degree for each pixel. Figure 1 was obtained before the solar eclipse. It was included as to give a proper comparison to the later figure obtained during the eclipse. Figure 2 shows the real time dual circular polarization time plots generated from the built-in software RadioUniversePRO v.1.4.8. Figure 2 shows schematically a part of real time intensity changes during mapping as the telescope beam scanning across the Sun. The intensity was found to vary as shown in Figure 2.

Figure 1 – The standard interface for the RadioUniversePRO software shows the Sun in raw data format.

Figure 2 – The real time flux density curve versus time plots. The plots represent dual polarization for the Sun’s signal
We would admit that it took roughly 15 minutes for a scanning and the follow- up scanning which included the mechanical movement by the antenna, setting of the device parameters, the fine tuning during the observation, recording the data, and the resetting for the follow-up scanning. New mapping with the same setting was repeated immediately after the previous scan. The whole process continued until the Sun was blocked by the hills at west of SHAO. A sequence of 10 × 10 degrees2 images of the eclipsed Sun was then obtained. Figure 3 shows an example for the uneclipsed Sun that observed in some other day for comparison. Figure 4 shows a sequence of diagrams as to present the different stages of the eclipse.

Figure 3 – The usual daily mapping for the Sun by making use SPIDER 300A
Figure 4 clearly shows that the received power of the Sun decreases as the eclipsed area increases. Since the beam of the telescope is 4.03 degrees, which is much larger than that of the Sun (<1 degree); unlike what we expect in optical images, the radio morphology of the Sun remains circular throughout the process.

Figure 4 – Sequence diagrams of the 0.89 partial solar eclipse in Hong Kong on June 21, 2020: a. Eclipse begins, b. Partial phase I, c. Maximum eclipse, d. Partial phase II, and e. Near the end of eclipse (blocked by hill).
The latter half of the sequence diagrams of the eclipse demonstrates the effect from the blockage of the hills nearby. Although our sequence diagrams are not able to cover the whole eclipse from the start to the end, the moment of the maximum eclipse (frames from UT06:28 to UT09:19 in Figure 4) is recorded, enabling further analysis of the process from the beginning to the maximum of radio eclipse. For interpolation of Figure 4, we use “RectBivariateSpline” function from SciPy package to interpolate data over rectangular meshes by bivariate spline approximation. In our actual operation, 36 values are interpolated between meshes in each direction, with 3 degrees of the bivariate spline. More comprehensive radio solar eclipse observations from better sites with better occasions and better instrumental conditions in coming years are expected, our result will serve as one of those records in Asia for future studies. Based on the data processing described, the percentage change of received radio power during the eclipse is shown in Figure 5 for 2020 partial eclipse.

Figure 5 – Solar eclipse observations with SPIDER 300A radio telescope in Hong Kong in the 21cm radio frequency band
As the resolution of the radio observation is less than that of the optical, previous studies (Sherwood, 1978; Tan et al., 2009) showed that the radio Sun in 21 cm appeared larger than that in optical, wider and shallower dips of radio power change compared to that of optical are to be expected. Our results from 2020 eclipse agree with the expected demonstrating shallower dip when compare with the optical eclipse models. For SHAO 2020 data, although we covered the very beginning of the eclipse, no significant delay is found from the reduced data. We postulate the delay may be too small due to the almost perpendicular intersecting angle between the Sun and the moon such that our instrument was not sensitive enough to determine the beginning moment of the radio eclipse. The expected delay mentioned is reasonably attributed to different paths, and so different thickness of the atmosphere of the optical and radio waves taken passing through between the almost perpendicular angle and later more “inclined angle” for the Sun’s positions appeared in the sky. And no significant delay was found. If more data at around −2 hour before eclipse maximum were obtained, a better estimation might be achieved. From the light curve, we found the drop in radio power is 55±5% at maximum eclipse, which means that the radio radius of the Sun is larger than that in optical. We can estimate the ratio between radio solar radius and that of optical from their differences in power drop. The simulation result is shown in Figure 6. Assuming the radio behavior of the Sun is similar to that in optical, the morphology of radio pattern is basically symmetric circular disc. We can obtain the expected light curves by substituting different solar radii (ranging from 1 to 1.5 solar radius) in the equation (Jason, 2019). The most fitted model would indicate the measured solar radius of our observations.

Figure 6 – The simulated light curve for the 2020 partial solar eclipse with different radio Sun’s radius.
During the solar eclipse, the eclipsed area in optical was smaller than that of the radio signals. Therefore, the power drop of the signals in optical would be more than that of the radio. And the result was shown in Figure 6. Solar radius is scaled with specific factors to see how the curves change. From the above result, we estimated that the radio solar radius is roughly 1.4±0.1 of that in optical. (Sherwood, 1978; Tan et al., 2009)
4. CONCLUSION
Based on the above observational results, we were glad to have accomplished the original planned goals for this study. Firstly, we managed to obtain the two-dimensional radio mapping animation for the 0.89 partial solar eclipse on 21 June 2020 in Hong Kong. The eclipse light curve in 2020 partial solar eclipse of radio was observed different not in proportion to the eclipsed area from of the optical as expected. There was about 55±5% of the maximum radio eclipse recorded compared to a 86.08% eclipsed area in optical. And the radio solar radius detected during the solar eclipse in 21 cm was related to chromosphere and corona, but not to the photosphere. The photosphere of the Sun defines the solar disc optically. During the solar eclipse, the optical light of the Sun is blocked by the moon. The radio signals in 21 cm at the chromosphere and the corona of the Sun, however, remain observable during the solar eclipse. Therefore, we may recognise the signals observed as the radio solar disc.
The 2020 observation for the 21 cm radio solar eclipse was unprecedented in Hong Kong. Probably, other South East Asia countries may have similar observations. Therefore, our observation data obtained can serve effectively to contribute to the radio data all over the world. There was a radio quiet zone in Hong Kong, such that we propose constructing a radio interferometer array over there. In fact, we wish to implement the plan soon since it is reasonably good for the development in radio astronomy in Hong Kong. And we developed a simple systematic pipeline data reduction approach for dealing with the data obtained from the SPIDER 300A telescope. And the calibration function for the SPIDER telescope is expected to be completed soon, and hence we can properly calibrate all the coming observational results. The results we have obtained are good enough for initiating further studies and collaborations with other countries and research groups, and for comparing our data with their results.
REFERENCES
Jallod U. E. and Abood K. M., 2019, Progress In Electromagnetics Research Letters 85, 17.
Jason S., https://www.maplesoft.com/applications/view.aspx?SID=4343&view=html
Kruger, A., 1979, Introduction to Solar Radio Astronomy and Radio Physics, D. Reidel Publishing Company.
Kundu, M. R., 1965, Solar Radio Astronomy, Interscience Publishers.
Kundu, M. R. and Gergely T. E., 1980, Radio Physics of the Sun (International Astronomical Union Symposia, 86), Springer Company.
Liu Y. Y. and Fu Q. J., 1998, Progress in Astronomy 16, No.3 Sep.
McLean, D. J. and Labrum, N. R, 1985 eds., Solar Radiophysics, Cambridge University Press.
Reber, G., 1944, Astrophys. J. 100, 279.
Rhodes B., 2019, Skyfield: High precision research-grade positions for planets and Earth satellites generator, (ascl:1907.024).
Sawant H. S., Srivastava N., Trigoso H. E., Sobral J. H. A., Fernandes F. C. R., Cecatto J. R., Subramanian K. R., 1997, Advances in Space Research 20, 2359.
Sherwood H., 1978, Radio Universe, Chinese edition.
Tan B. L., Yan Y. H., Zhang Y., Tan C. M., Huang J., Liu Y. Y., Fu Q. J., Chen Z. J., Liu F., Chen L. J., and Ji G. S., 2009, Science in China Series G: Physics, Mechanics and Astronomy 52, 1765. Velusamy T., Kuiper T. B. H., Levin S. M., Dorcey R., Kreuser-Jenkins N., and Leflang J., 2020,
Publications of the Astronomical Society of the Pacific 132, 1015.