The Sun is one of the most interesting radio sources in the sky and solar radio emission can be studied by using SPIDER radio telescopes. The Sun not only emits visible light but also other frequencies in the electromagnetic spectrum, in fact you can feel the Sun heat on our skin, expression of infrared radiation. In this article with step-by-step guide, by using a 3 meter diameter SPIDER 300A radio telescope, we see how to detect radio waves coming from the Sun and generate various results (like radio images and transits) by using the RadioUniversePRO control software. We perform automatic pointing and tracking on the Sun, detection and removal of eventual artificial signal and capture of results.
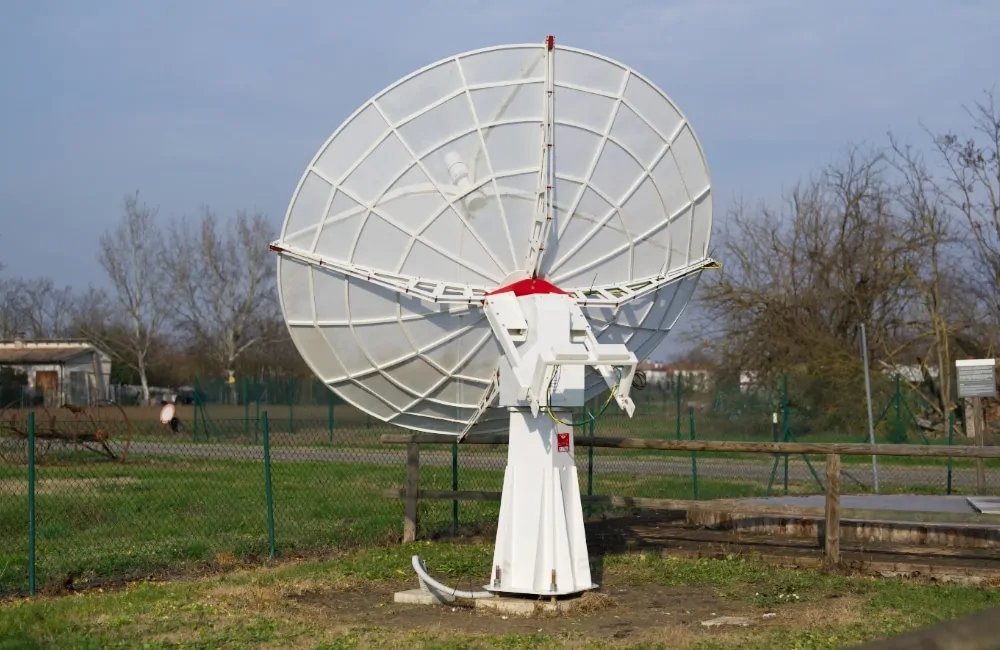
Solar radio emission with SPIDER radio telescope: SPIDER 300A radio telescope
The Sun emits radio waves for both thermal (due to its high temperature) and for non-thermal (for example synchrotron radiation when the electrons are forced in a spiral motion around magnetic field lines) emissions. For wavelengths greater than 1 cm (ie less than about 30 GHz), the solar radio emission is made up of two components: a constant one called “Quiet Sun” due to the heat of our star and a variable one called “Disturbed Sun” that varies over time and depends on the presence of sunspots or flares. SPIDER radio telescopes allow you record these emissions. Start RadioUniversePRO software and connect SPIDER’s mount and receiver. In the IF Monitor tab you will see the radio telescope data in real time, as you can see in the picture below.
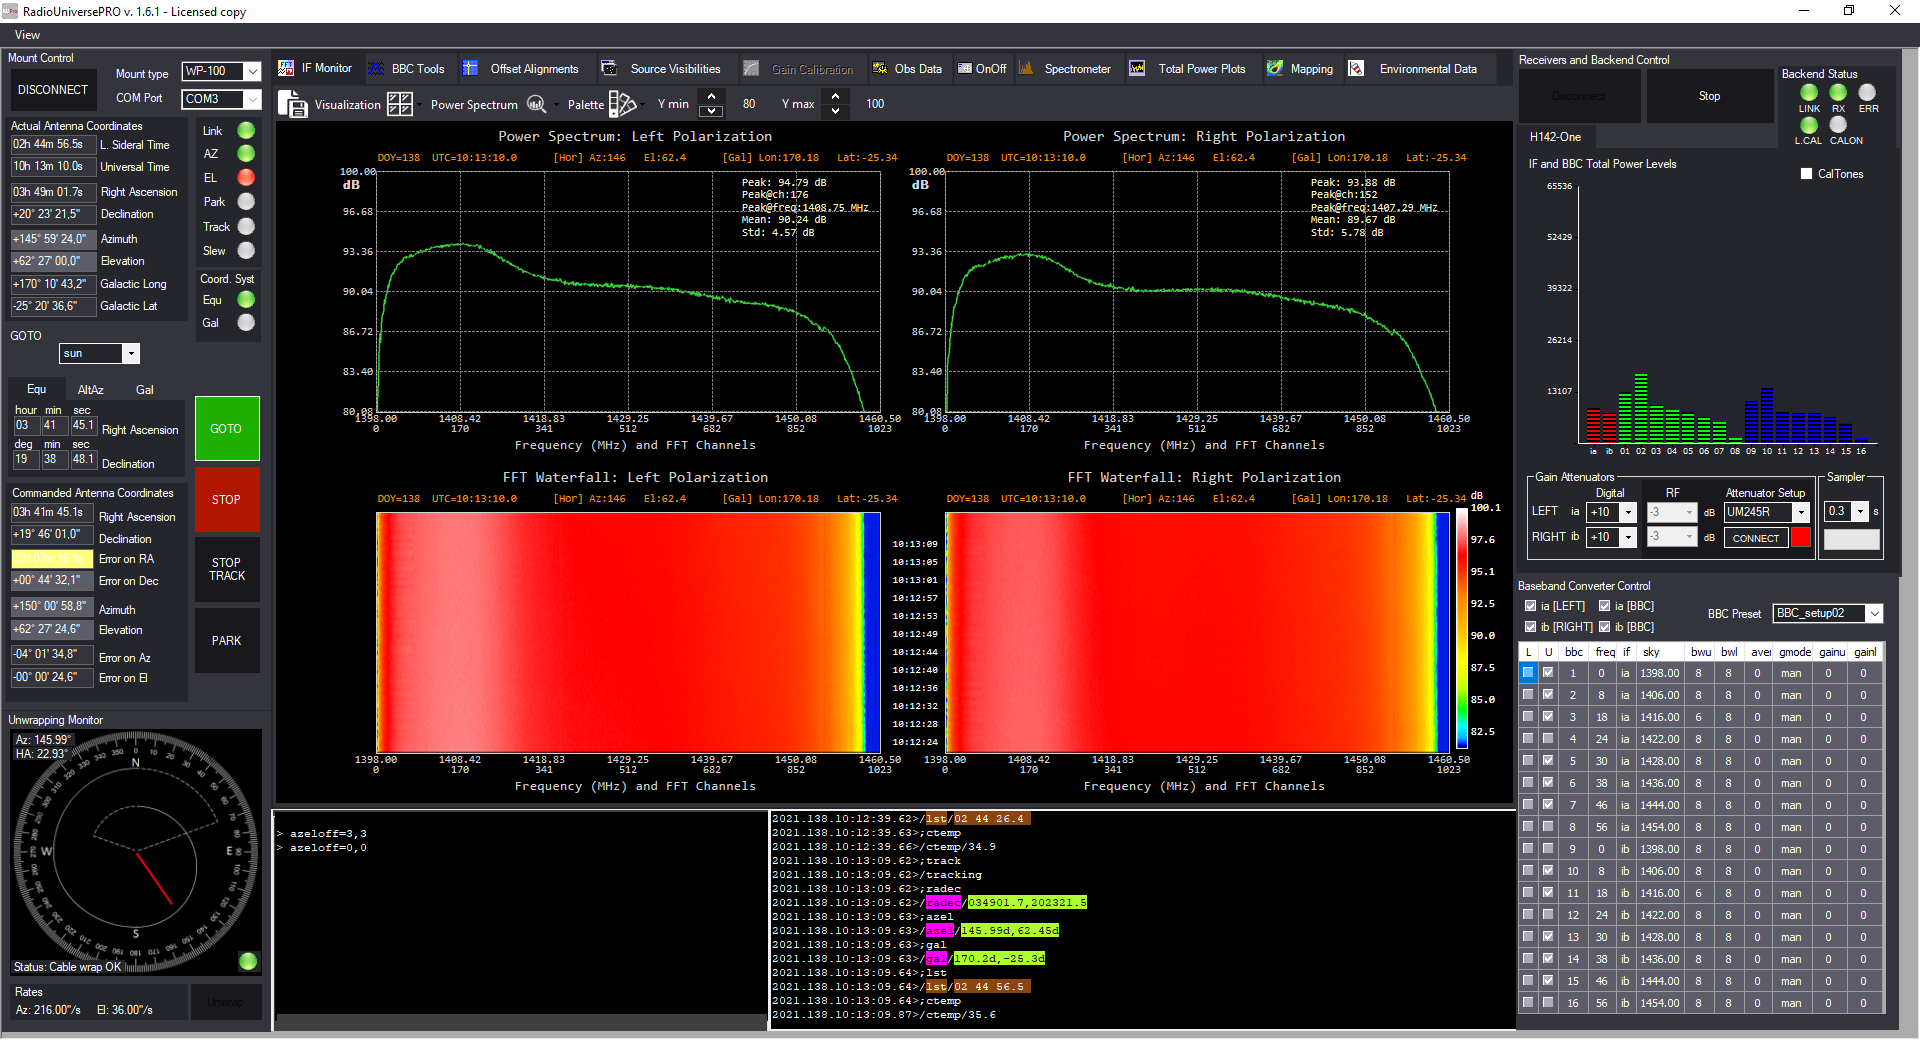
Solar radio emission with SPIDER radio telescope: RadioUniversePRO software and IF Monitor
Now select the “Source visibility” tab and double click on the “Sun” radio source. SPIDER radio telescope will automatically point the Sun. In order to verify the perfect alignment on the Sun, you can use the “Offset alignment” feature in the proper tab. Here you can select the proper parameters in order to request the radio telescope “scan” the sky around the Sun position and search for the point of the maximum radio emission, that will correspond to the real position of the Sun in the sky: this way the mount will per perfectly and automatically synced to the sky and will perfectly track and point any radio source. Press the “Start procedure” button to start, SPIDER radio telescope will automatically and precisely detect Sun position.
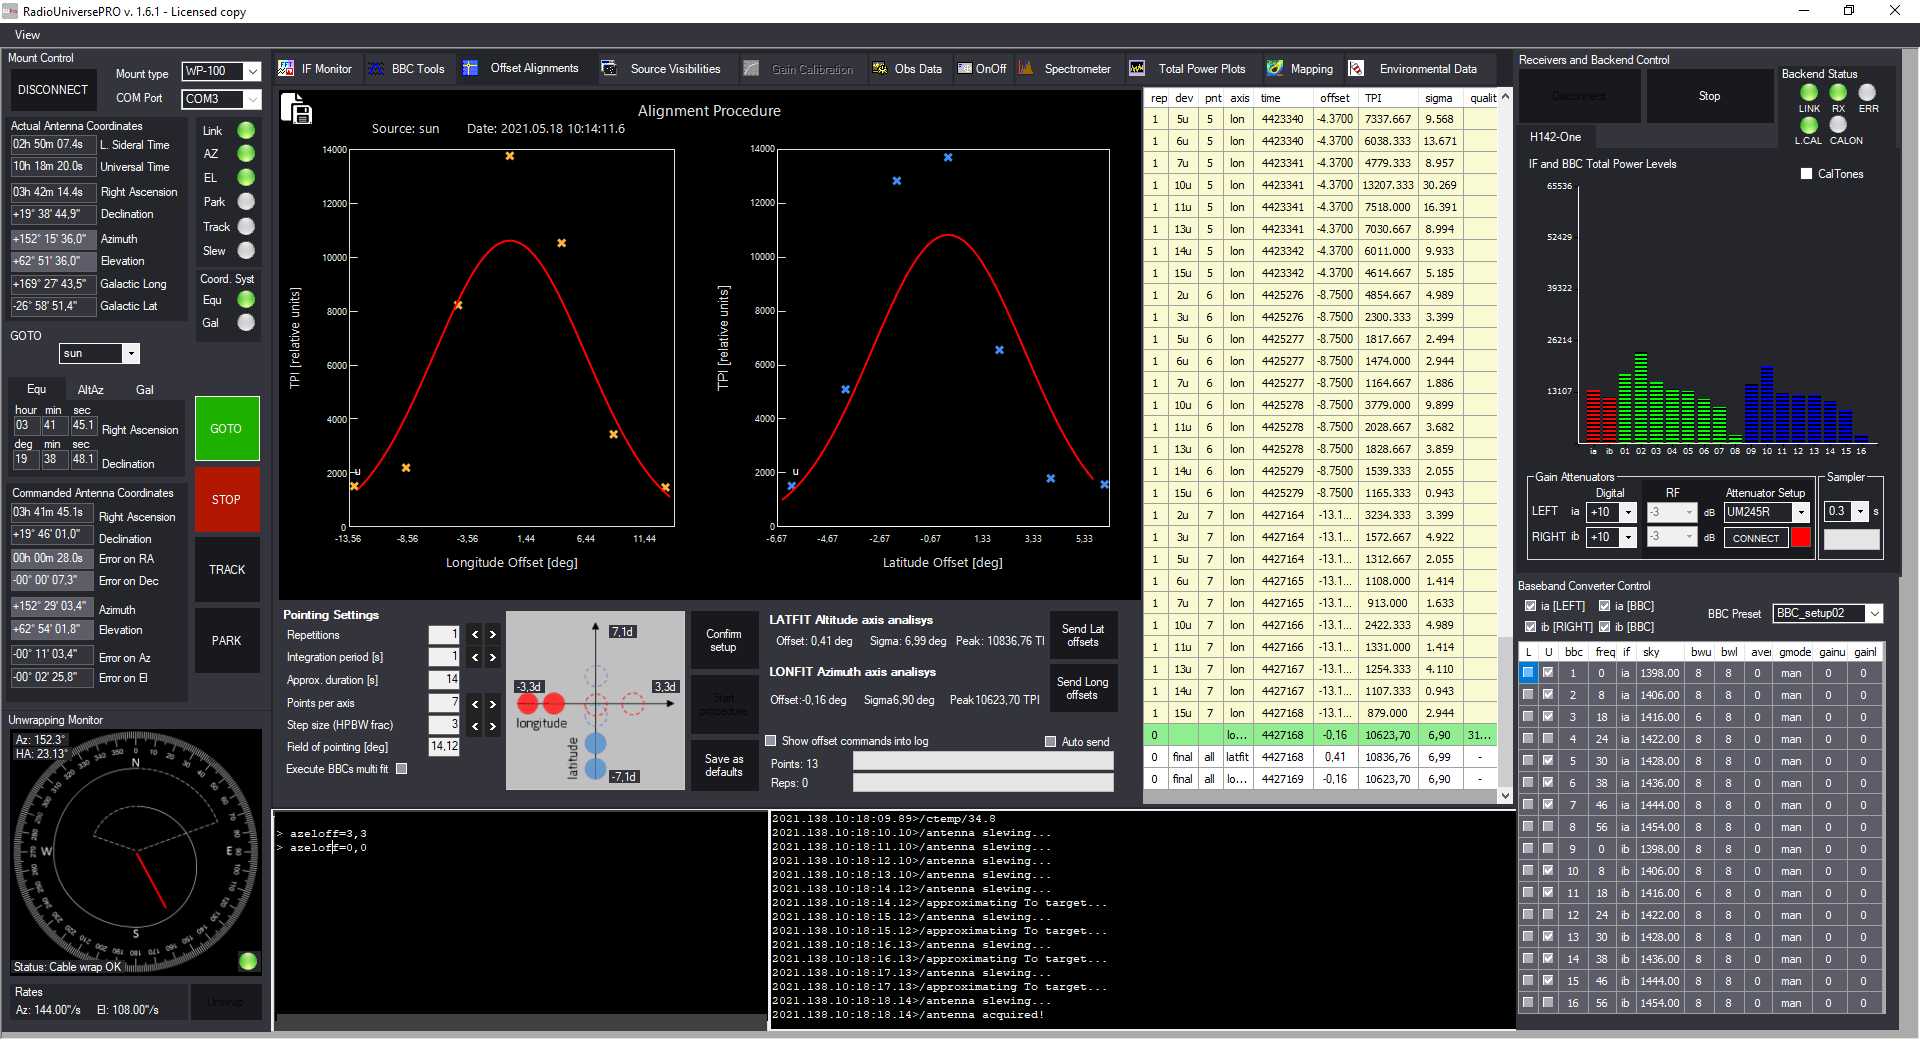
Solar radio emission with SPIDER radio telescope: automatic alignment to the Sun
Now select BBC Tool tab and check for signal quality. Here you can see if you have interferences caused by artificial signals and easily remove parts of the spectrum, if needed. Please note that interferences caused by artificial signal vary upon your location and the direction pointed by SPIDER radio telescope so you need to check BBC Tools before starting your data recording.
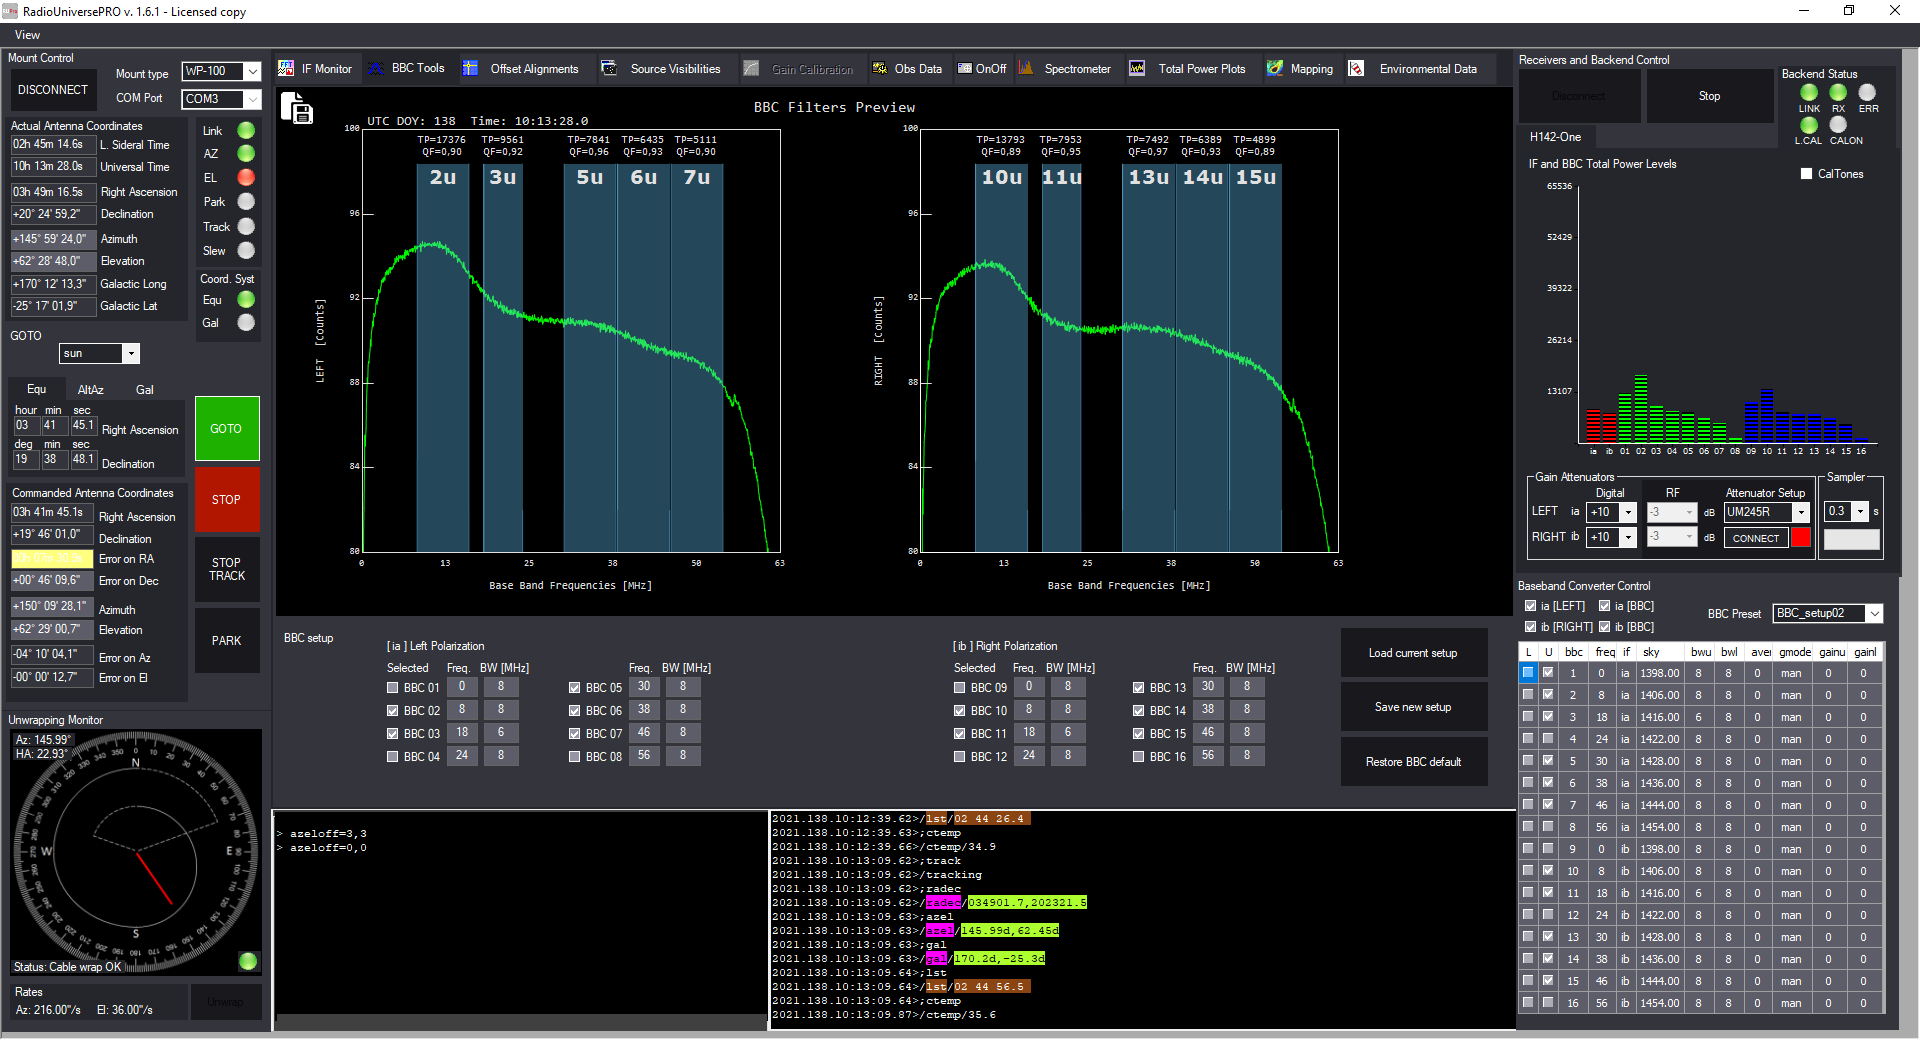
Solar radio emission with SPIDER radio telescope: BBC tools allows you to remove RFIs if present
Being sure that we’re perfectly aligned on the Sun and that we’re not recording artificial signals, we can now start recording data and producing results. Let’s start with a Cross-Scan of the Sun. This technique consists in moving the radio telescope creating a cross centered on the object and recording radiometric data for every point: this will allow us to determine the maximum radio emission. In order to perform this operation, we select the “Total Power Plot” tab in RadioUniversePRO and use the Cross-Scan feature, by selecting the length of the scan, the separation of every recording point and the integration time of every recording point. SPIDER radio telescope mount progressively moves the antenna position and RadioUniversePRO software creates a graph like this one one you can see in the picture below. Cross-Scan feature can also be used to calculate radio telescope parameters like the half power beam width (HPBW).
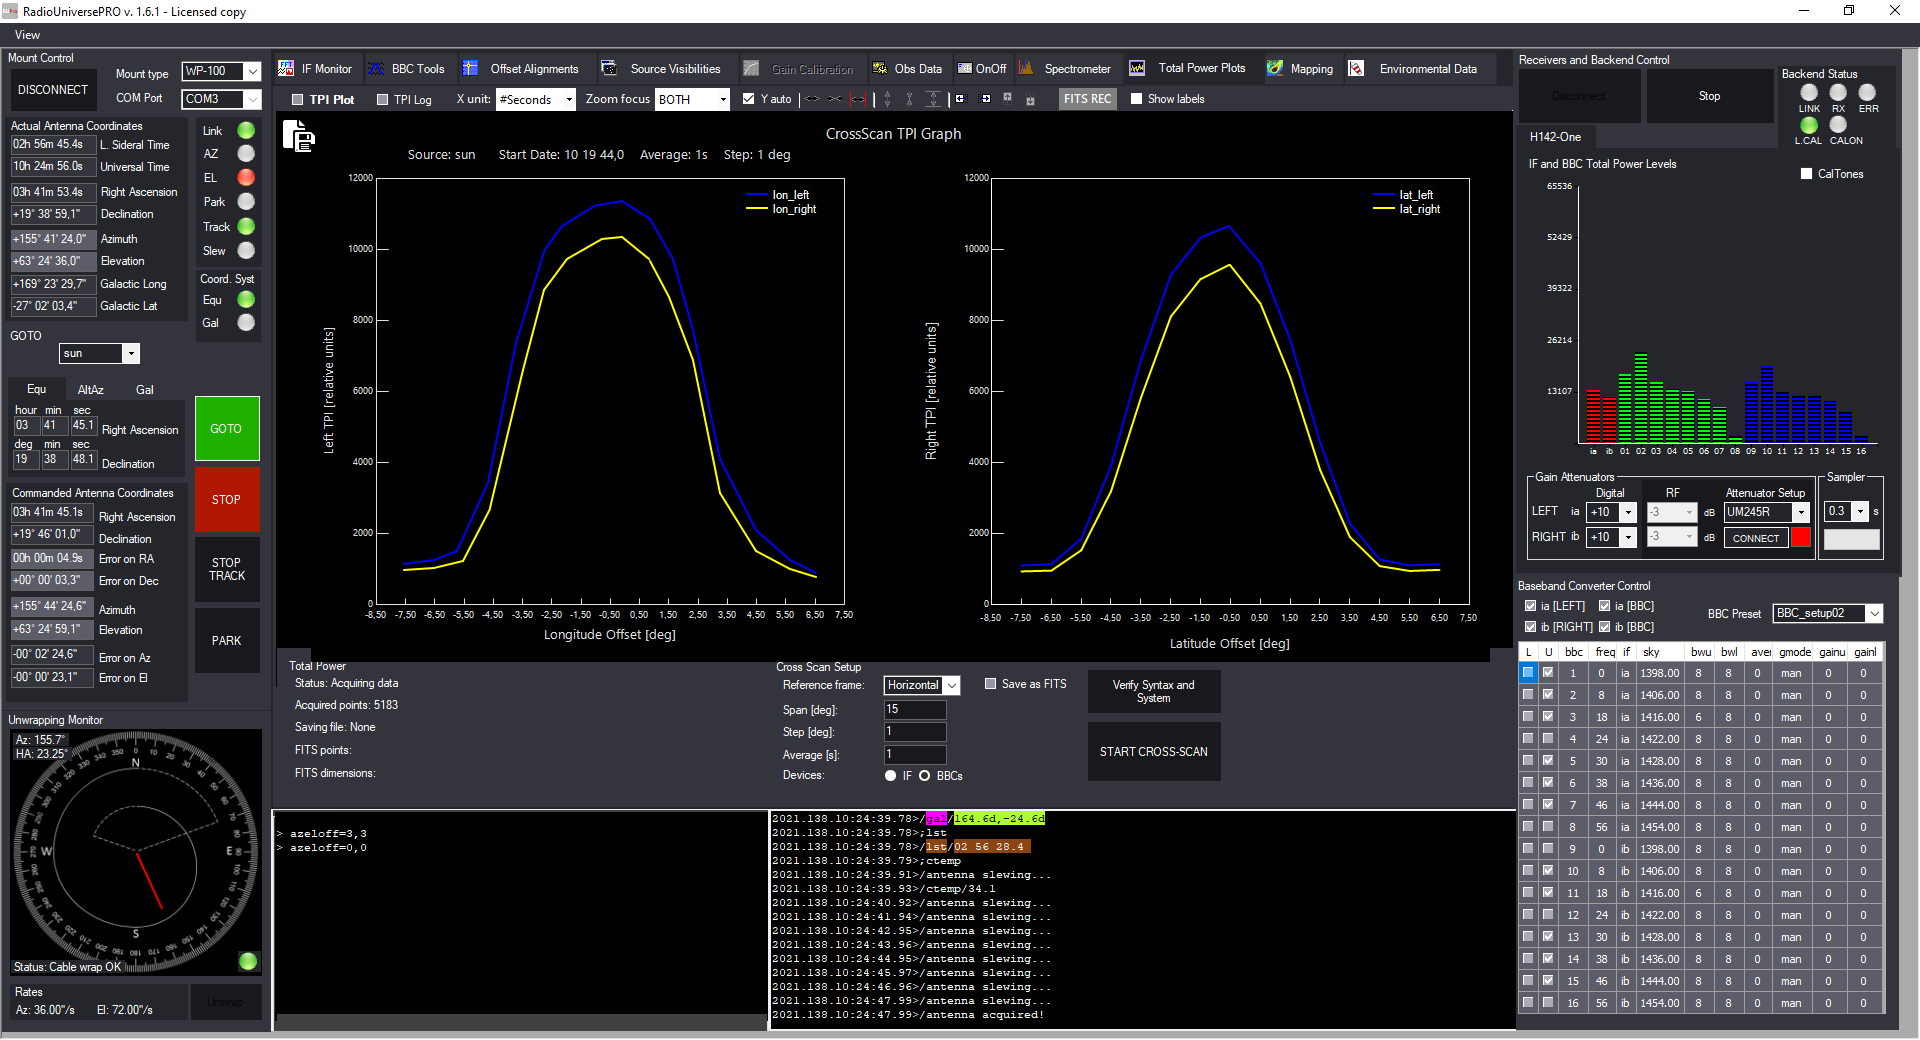
Solar radio emission with SPIDER radio telescope: Cross-Scan centred on the Sun
Since the SPIDER 300A radio telescope is perfectly aligned with the Sun, we can also keep tracking the Sun for a long period of time and use the TPI Plot feature of the Total Power Plot tab of RadioUniversePRO in order to check for possible variations of radio emission from the Sun. In the graph, every line corresponds to the radiometric value of every BBC filter that we selected in the previous step.
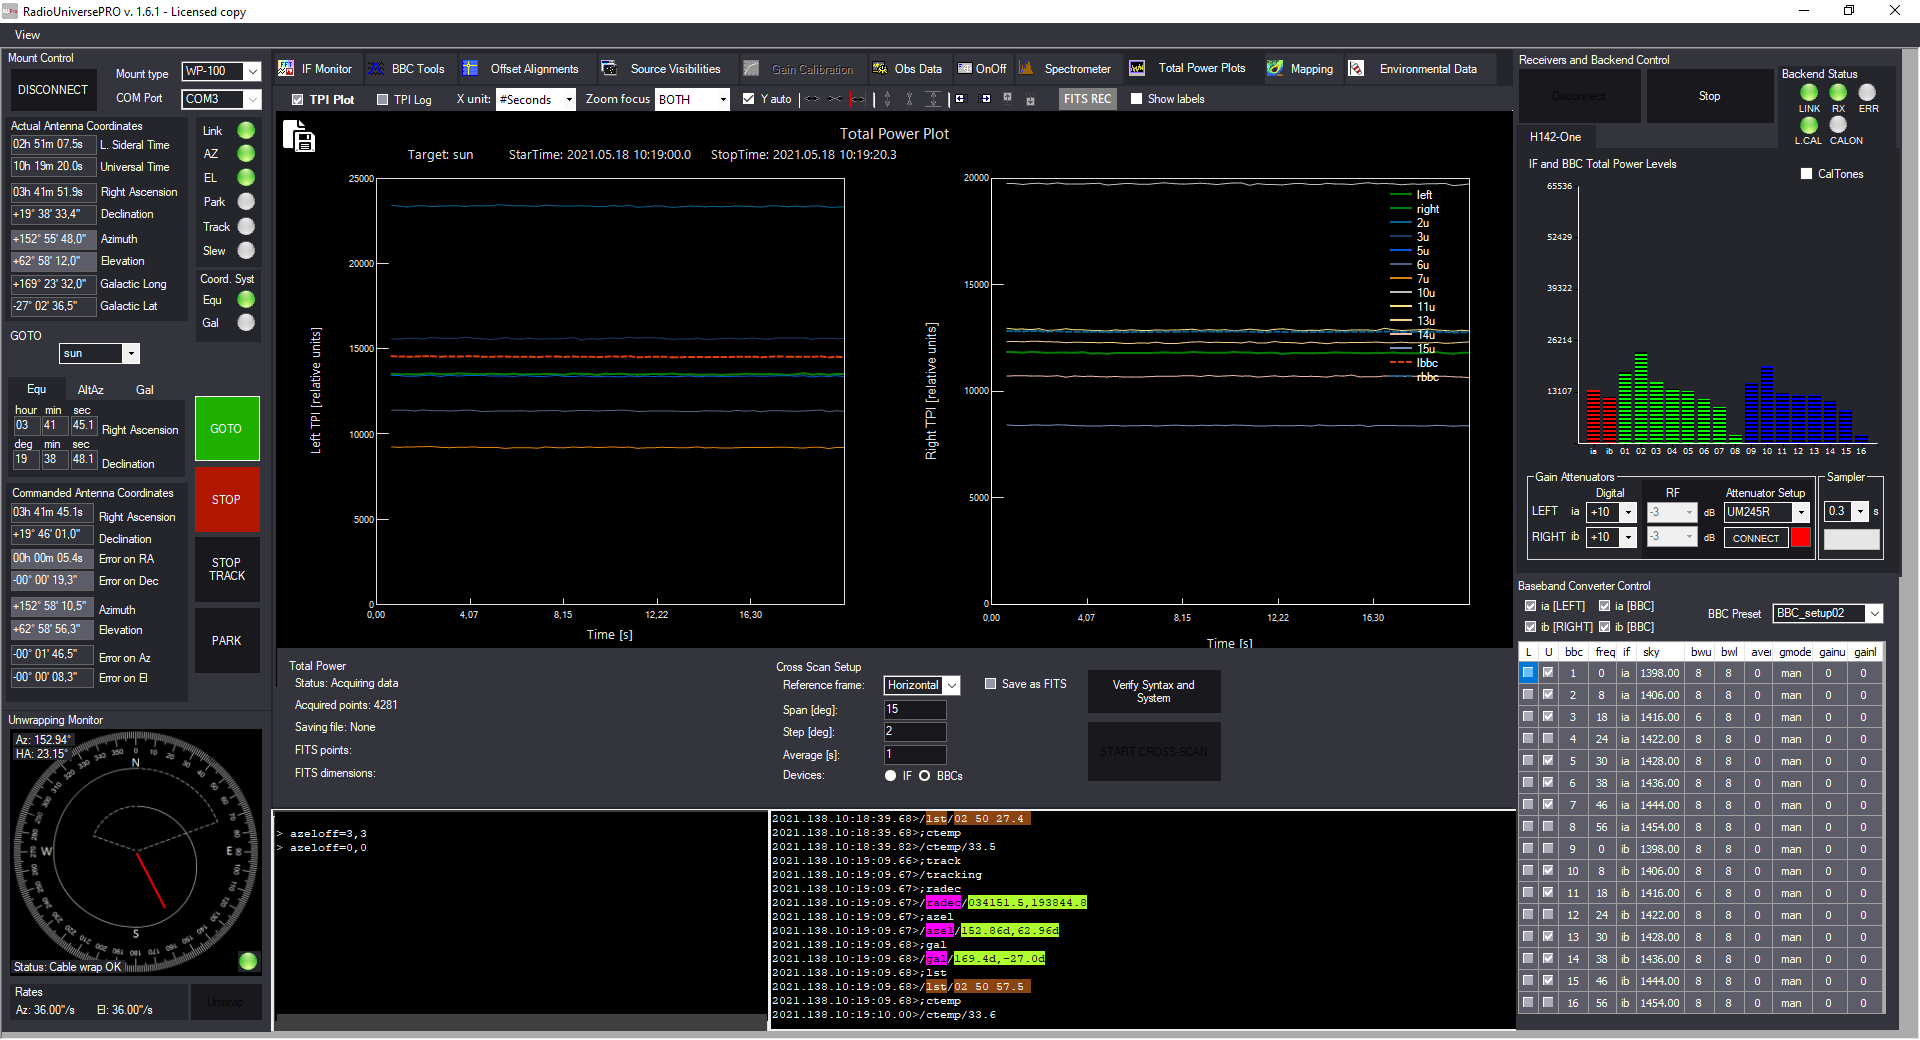
Solar radio emission with SPIDER radio telescope: TPI plot of the Sun
Now we produce a radio map, a real image of the Sun recorded in the radio frequencies. We select the “Mapping” tab where we can set all the recording parameters of the radio map. The SPIDER radio telescope will scan the sky area around the Sun, depending on the size of the radio map, the separation and the duration of data capture of each point that compose the map. The map will then be displayed by RadioUniversePRO using one of the different user-selectable color scales. In the image below, the result of the capture of the radio map of the Sun, with an area of 15 degrees of side. The effects of the lateral lobes that form the cross pattern around the central figure of the Sun are also visible.
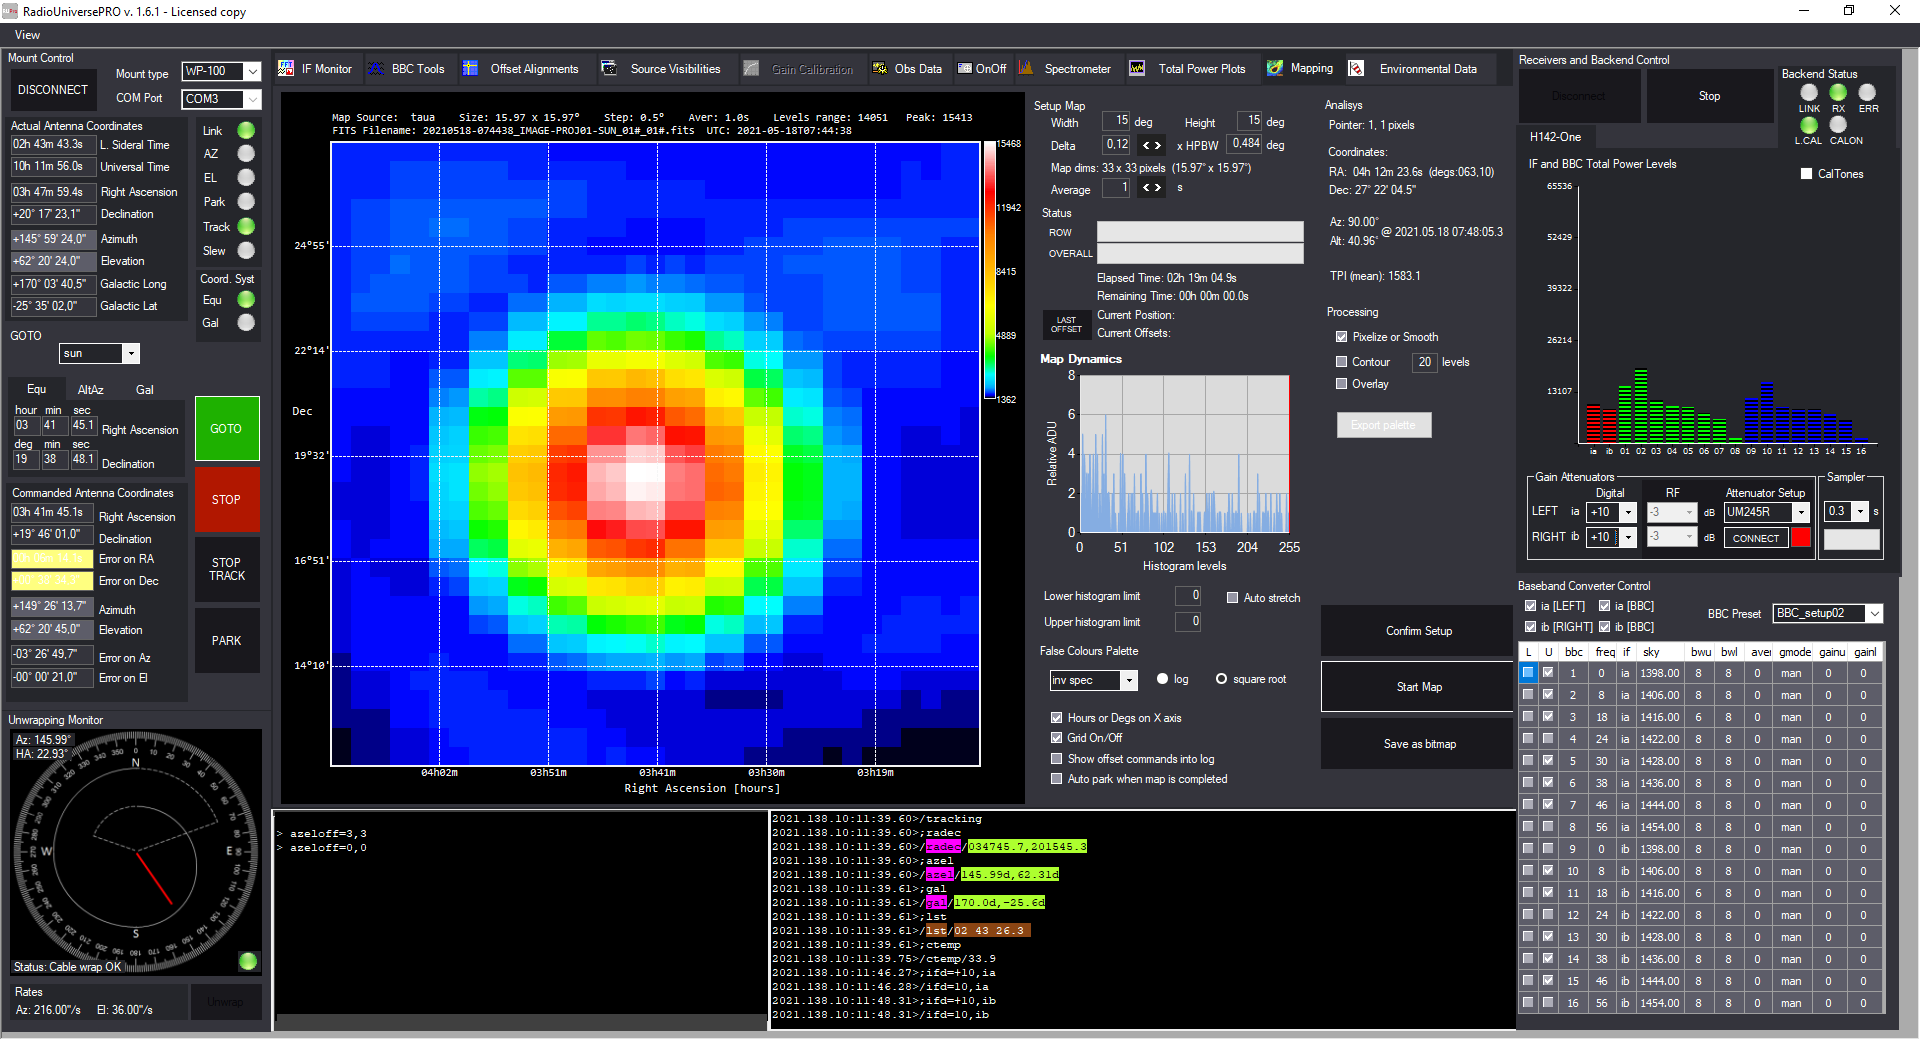
Solar radio emission with SPIDER radio telescope: radio map of the Sun
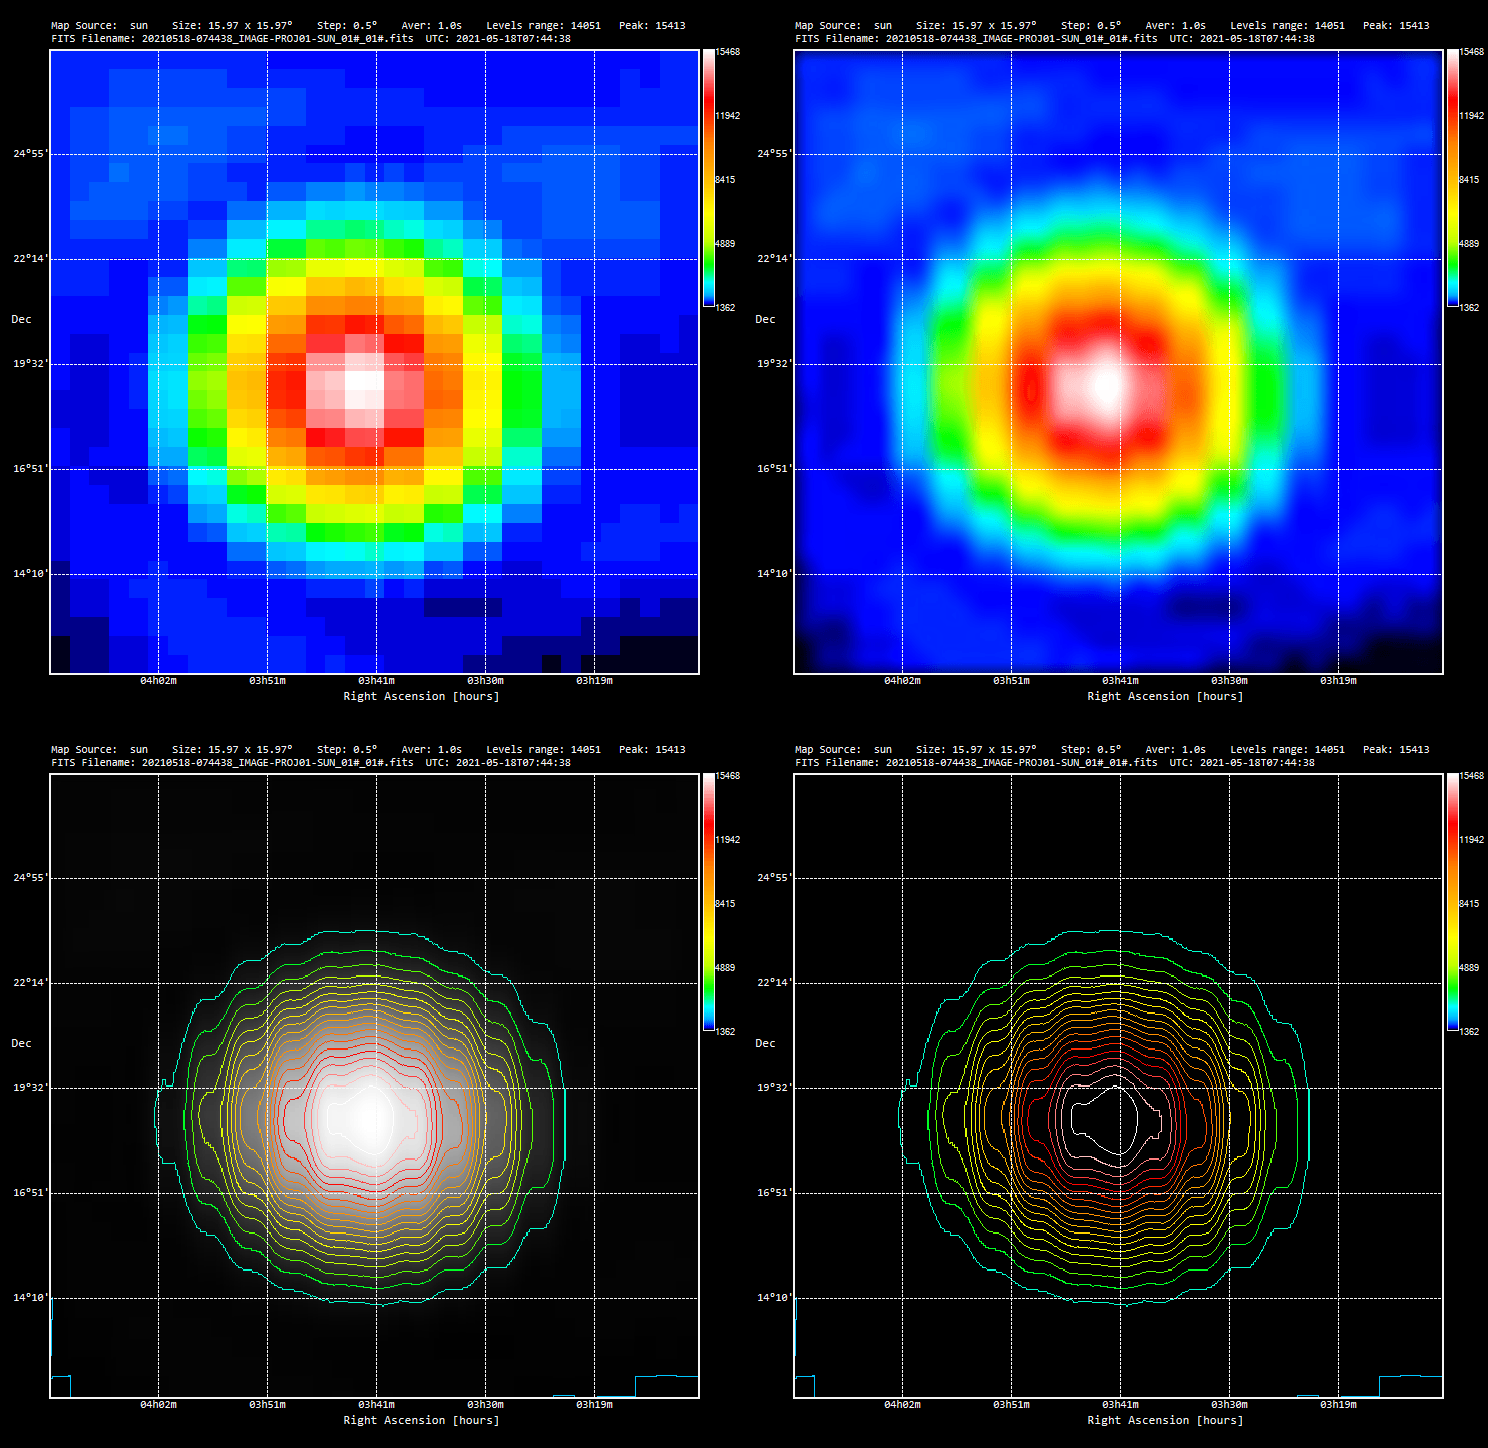
Solar radio emission with SPIDER radio telescope: different radio map view options in RadioUniversePRO
Thanks to SPIDER radio telescope and RadioUniversePRO software, you have a set of data that you can easily compare with data recorded even by professional radio telescopes. Some sources available on the Internet:
Nobeyama Radio Observatory: http://www.nro.nao.ac.jp/en/
Australian Government – Radio and Space Weather Services – Learmonth Observatory: http://www.ips.gov.au/Solar/3/4
Ottawa 10.7cm radio flux: http://www.spaceweather.gc.ca/solarflux/sx-eng.php
